Chart patterns contain extremely valuable information traders can use to predict or monitor trends and price movement. If you ever received my Rocket Trade Signals, you’ll know that chart patterns are one of my favorite tools. Recognizing specific chart patterns can give traders a huge edge that allows them to maximize their profit potential and minimize risk exposure. Below are five chart patterns (with examples) that I think every trader should know.
Ascending Triangle
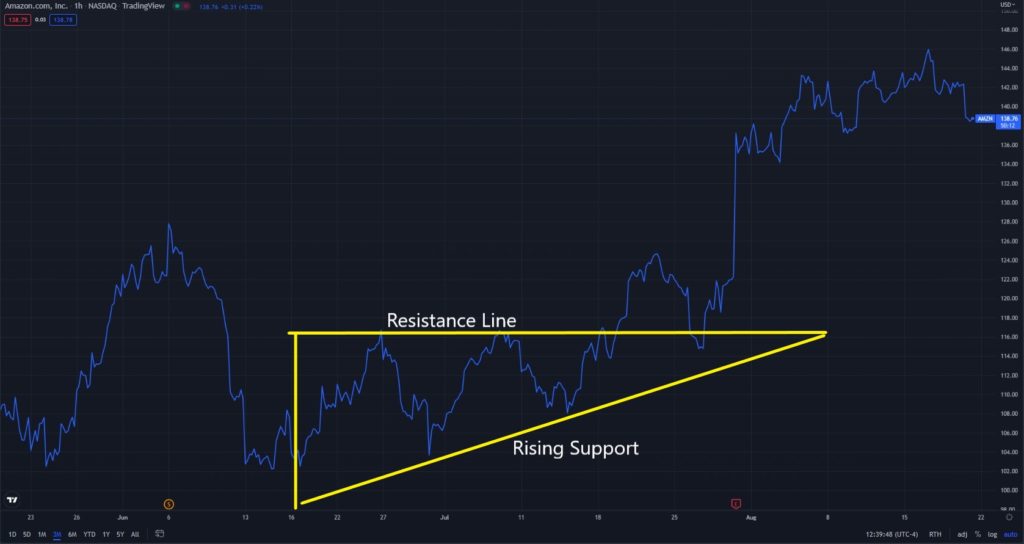
Ascending triangles usually form when a stock makes higher lows and meets resistance at the same level, forming a horizontal line. The stock price keeps testing this resistance until it eventually breaches. Rising support levels begin to converge with the horizontal resistance as volume contracts, hence the “triangular” formation. Despite its resemblance to chart patterns like “Flags” or “Pendants,” ascending triangles have broader ranges and timeframes to materialize (usually 1-3 months).
An ascending triangle is usually the continuation of a stock’s uptrend. Price projection for this setup is typically found after the stock’s initial breakout. You can measure the uptrend’s longest price range after it breaks resistance, and use it to project the move’s potential size. Breakouts with higher-than-average volume usually have a higher rate of success. It’s not uncommon to see a return to breakout price levels as old resistance becomes the new support. This creates a second entry point, where traders can set stop losses just below the breakout’s previous resistance level.
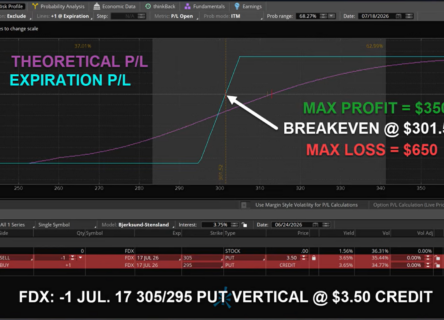
The example below shows an ascending triangle that Amazon (AMZN) formed back in June, before breaking out in late-July. I issued three Rocket Trade Signals for Amazon during this timeframe on June 17, 30, and July 18.
Cup & Handle
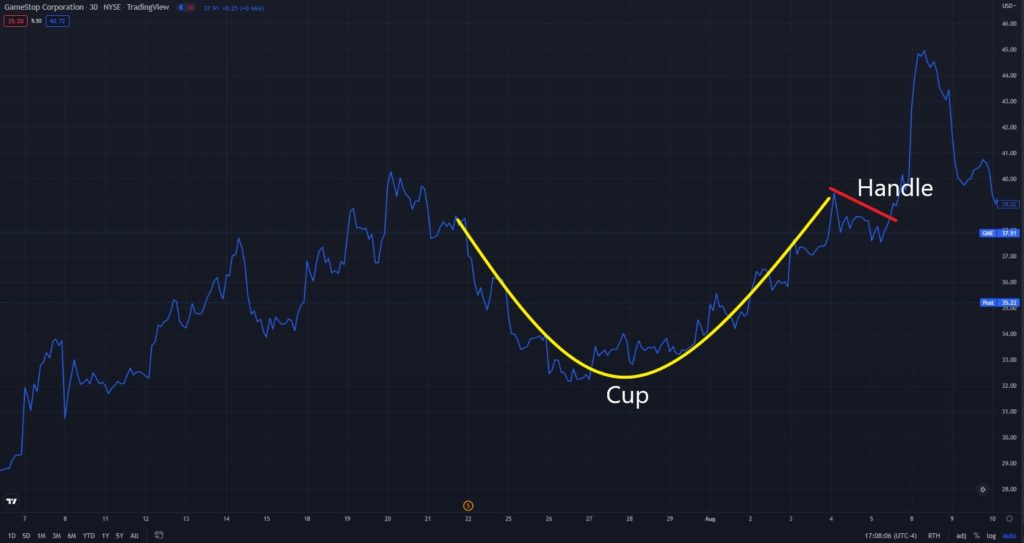
This chart pattern forms when a stock enters a downtrend and rebounds (during which it forms a roundish U-shape). It then takes a smaller subsequent dip before the actual breakout occurs. This formation features two key components – a “cup” and “handle”. The “cup” materializes when traders sell to take profits, causing a corrective move to the downside. The price levels out after finding adequate support and running out of sellers at its new low. Buyers then move back in, and drive the price up, as sellers still in the stock seek higher prices. The stock price then increases after new buyers enter. When the price returns to pre-correction levels, it’s followed by another brief downtrend – i.e. the “handle.”
A cup and handle is an important chart pattern, because the U-shape formation has a higher breakout probability than a V-shape setup. It should ideally form after a clear uptrend in order to have the highest odds of success. When the pattern forms a handle inside the trading range, it’s taking a second run at new highs. Once a stock breaks out above the handle, it’s a good indicator to buy. The breakout propels the stock upwards as more bullish buyers jump in and increase its price.
Below, you see a cup and handle that formed while I was monitoring GameStop (GME). I released two winning Rocket Trade Signals when this setup first started forming. The first was on July 19. I issued the second right before its breakout on August 8.
Double Bottom
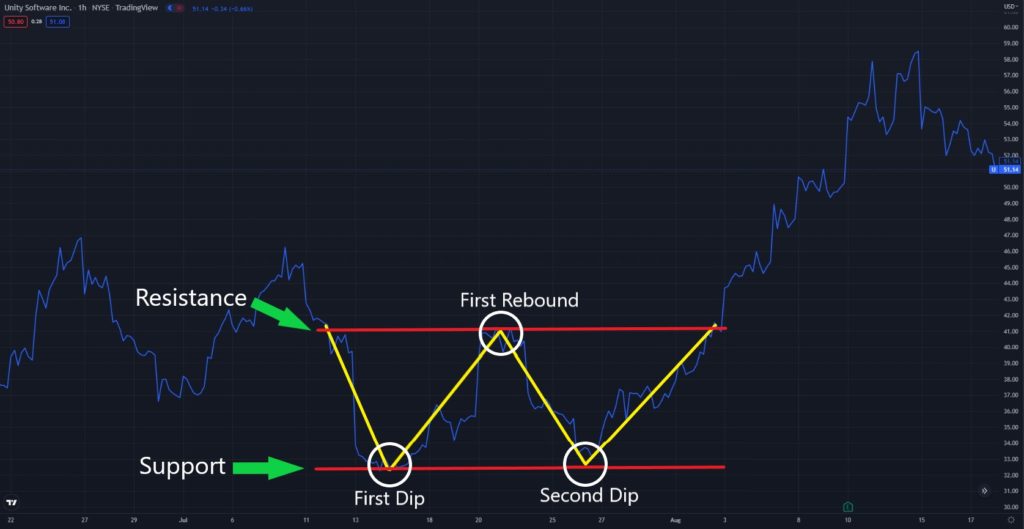
Double bottoms are considered the most popular bullish reversal chart pattern. These W-shaped chart formations occur when a security’s price drops to its support level, rebounds a first time, drops again (to a similar level as the first dip), and then rebounds a second time. A double bottom usually forms when the market struggles to make lower lows, and exhibits signs of a bullish takeover.
Some of the best double bottoms form when the second dip falls beneath the first one’s low, and closes above that level. This pattern typically marks the transition from a downtrend to an uptrend, and usually takes 2-3 months to form. The more distance between the first and second bottoms increases the pattern’s likeliness of a breakout.
I tracked a double bottom that Unity Software (U) formed throughout this past July, before it skyrocketed in early August. I released a Rocket Trade Signal that caught good upside movement on July 14, as the stock price rebounded off the first dip.
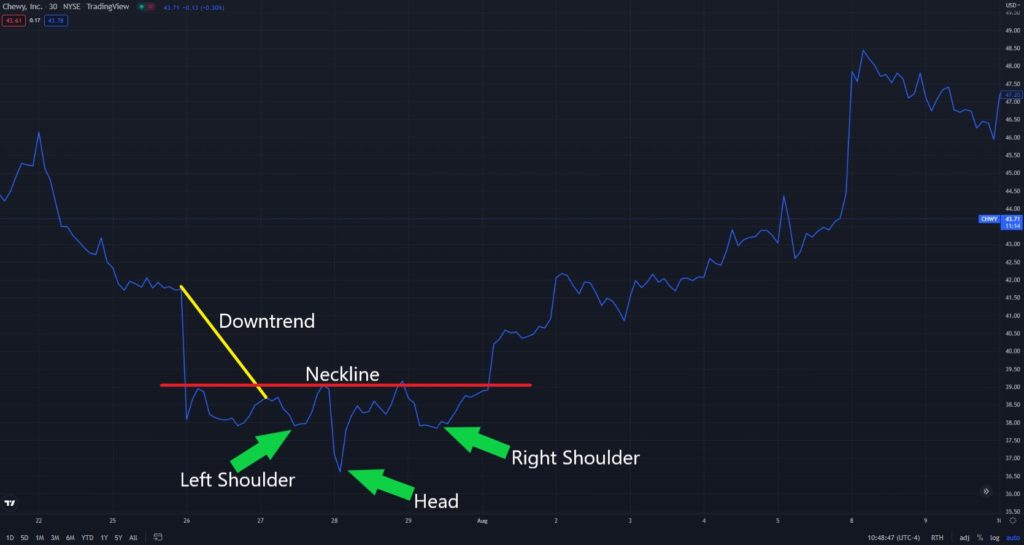
Inverse Head & Shoulders
This chart pattern resembles a double bottom, and indicates a reversal following a bearish trend. The biggest difference between a double bottom and inverse head and shoulders is the latter has three bottoms. An inverse head and shoulders forms when a security’s price falls, rises, falls a second time, rises again, and then drops a third time.
The formation’s “shoulders” are signified by the price’s bounces off support after the first and third dips. The “head” is indicated by the second drop, which is always lower than the first and third. A general rule to follow with this pattern is the “shoulders” don’t go lower than the “head”. The line of resistance the security price hits after the first and third dips called a “neckline”. It’s worth noting that when the right “shoulder” is higher than the left one, there’s a better chance the chart pattern may result in a clear breakout and trend reversal.
Chewy (CHWY) formed this chart setup before its price spiked over 24% going into the month of August. I deployed a Rocket Trade Signal after this breakout occurred.
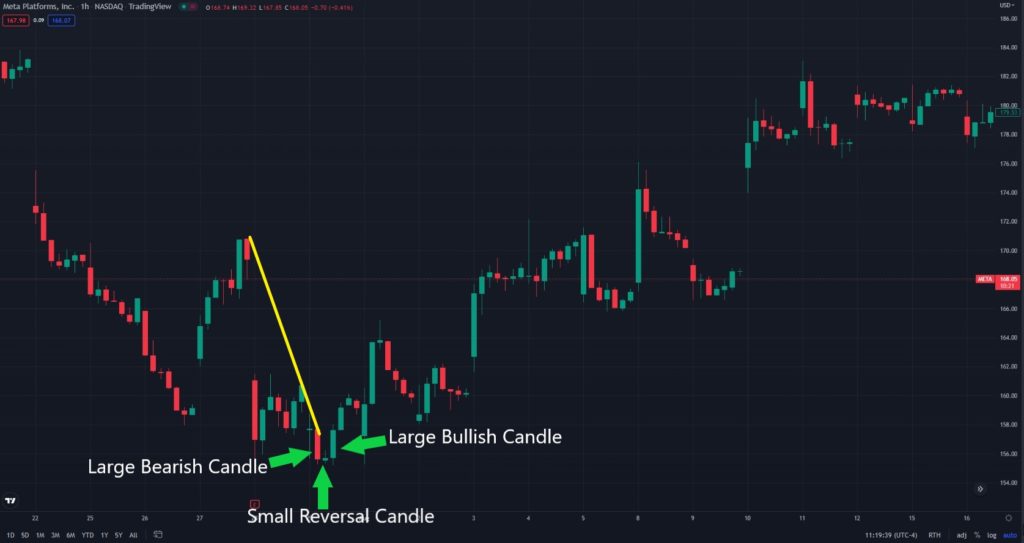
Morning Star
Identifying this chart pattern requires a candlestick chart. A morning star forms after a downtrend. It signals the start of an upward climb. It’s ultimately considered a warning sign that the downtrend is transitioning into upward movement. A morning star consists of three candles – a bearish candlestick, a small reversal candle off lows [also known as a doji], along with a third bullish candle that opens higher than the middle candle, and closes near its day’s highs.
The first candle shows continuation of the downtrend. The second candle indicates market indecisiveness in the market. The third candle shows the bullish reversal that’s expected to occur. Ideally, the second candle is completely out of the first and third candle’s real bodies. However, as long as there’s spacing separating the second candle from the first and third, it’s usually a positive sign. Morning stars are more meaningful when they form near previous key support levels. Traders can confirm signs of a morning star reversal by using other technical indicators like the relative strength index (RSI).
I made out really well when this morning star formed on Meta’s (META) chart last month. After the reversal occurred, I released two winning Rocket Trade Signals on August 1 and August 8.
Enjoying our content?
Start receiving Charlie’s Rocket Trade Signals
Subscribe to our free newsletter – Traders Daily Brief
Read more of our blogs