
A.I. technology has unique capabilities that are helping more people reshape how they trade. Its dynamic abilities to make specific technical calculations at unparalleled speeds help identify trade setups triggered in stocks with historically high probabilities of making potentially explosive moves.
What Are Trade Setups?
In a nutshell, trade setups are technical formations a stock makes when it’s poised to potentially make a significant price move. Every trade setup must satisfy a detailed checklist of technical requirements to get “triggered” in a stock. Each requirement typically involves the stock price moving higher or lower than a certain technical indicator – usually all at once – and within specific time intervals.
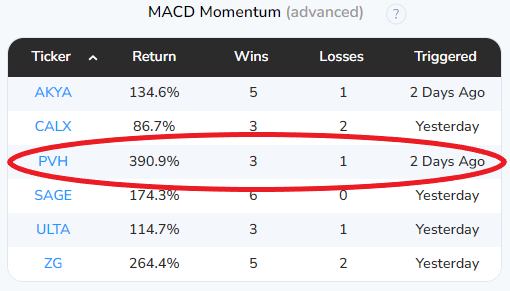
Pro Trader Charlie Moon started using an A.I.-backed trading platform called the Trade Finder that’s designed to find potential high-profit options plays with these trade setups. The Trade Finder simultaneously scans thousands of stocks for these setups. It uses hundreds of technical indicators, and produces real-time results in about 60 seconds. The A.I. displays its findings by categorizing which stocks were triggered by each trade setup. Here’s a snapshot of what those results looks like:

For each stock, the Trade Finder lists its ticker symbol, cumulative returns, how many winning and losing trades it previously made, along with when the trade setup was triggered.
To show how well these setups work, Charlie started sending 1-3 potentially explosive option plays the Trade Finder spots every day. Click here for more information on Charlie’s free daily trade ideas.
Main Takeaways
- A.I. technology is finding potentially explosive options plays by spotting certain trade setups that were triggered in stocks
- Trade setups are technical chart formations that indicate a stock is on the verge of potentially making a major price move
- Every trade setup must satisfy a list of specific technical requirements to get triggered in a stock
How Trade Setups Help A.I. Find Potential Winning Plays
As previously mentioned, A.I. technology – like Charlie Moon’s Trade Finder – simultaneously scans thousands of stocks with hundreds of technical indicators to find these triggered setups. After every market scan, the A.I. lists how many stocks were triggered by each trade setup. It then catalogs them into three tiers based on their complexity – beginner, intermediate, and advanced.
The Trade Finder analyzes each stock’s history (usually within a 1-3 year timeframe) to calculate how many times a trade setup was previously triggered. It then lists the stock’s cumulative returns off these instances, the outcomes for each trade, and when the setup was triggered.
If you’re wondering how the A.I. calculates these metrics, it maps out how to consider making each trade. It lists the type of option contract, number of lots, expiration, and expands on the historical data it gathers. The A.I. even generates a chart for each stock, showing when every trade setup was previously triggered, and the technical requirements to verify each one.
Although Charlie’s Trade Finder looks for dozens of triggered setups in stocks, we’ll explore three of the most common ones it uses to find potential high-profit option plays.
Bullish Burst (Beginner)
This is one of Charlie’s favorite trade setups because it’s among the most straightforward ones to follow. The Bullish Burst setup typically involves a quick and significant increase in buying pressure, causing sharp upward movement in the stock price. It can be triggered by positive news, market trends and sentiment, or breakouts above key resistance levels.
The Trade Finder spotted a Bullish Burst setup triggered in Everest Group (EG). Here’s a quick breakdown of what it looks like…
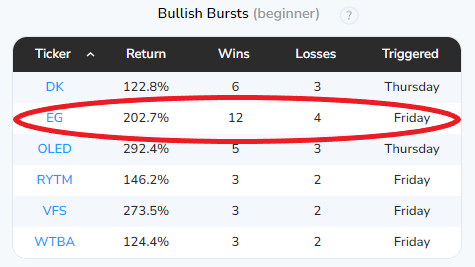
It found 16 instances where the Bullish Burst setup was previously triggered in EG. They produced 12 winning trades, and over 203% cumulative returns.
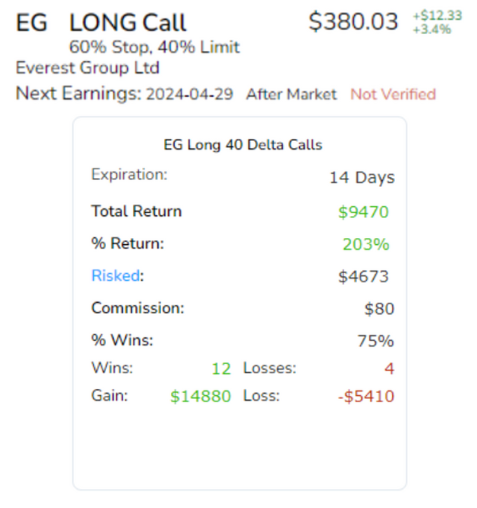
This next screen breaks down the highest-profit potential way to consider trading EG off this triggered setup. It lists what type of option trade to potentially make, when to take potential profits, and the trade’s expiration. We also see more details on the returns you could have potentially netted by trading EG this way all 16 times the Bullish Burst setup was previously triggered.
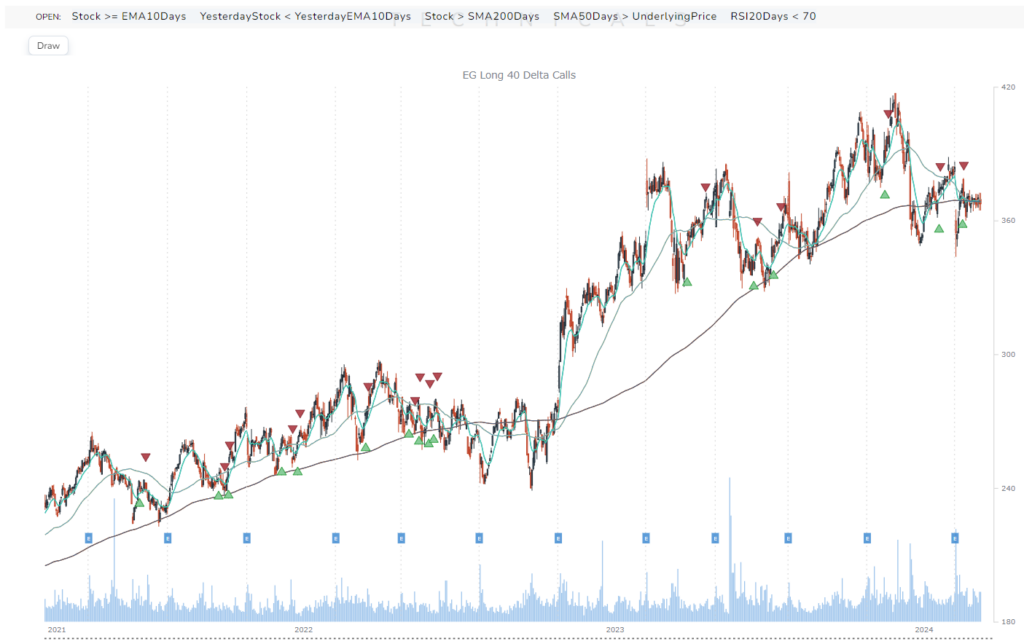
The next section contains a visual that reveals two important details.
First, it shows a chart that plots all 16 times the Bullish Burst trade setup was previously triggered in EG. The green and red arrows respectively represent optimal times for potentially entering and exiting each trade.
Next, let’s redirect our attention to the gray bar on top…

It lists the Bullish Burst’s technical requirements to get triggered in a stock. Here’s what each one says…
The stock price has to be above the 10-day Exponential Moving Average (EMA).
The previous day’s stock price (prior to its triggering) must be below the 10-day EMA.
The stock price must be above the 200-day Simple Moving Average (SMA).
The underlying stock price must be lower than the 50-day SMA.
The Relative Strength Index (RSI) must be greater than 70.
Let’s see how EG wound up moving after the Bullish Burst setup was triggered…
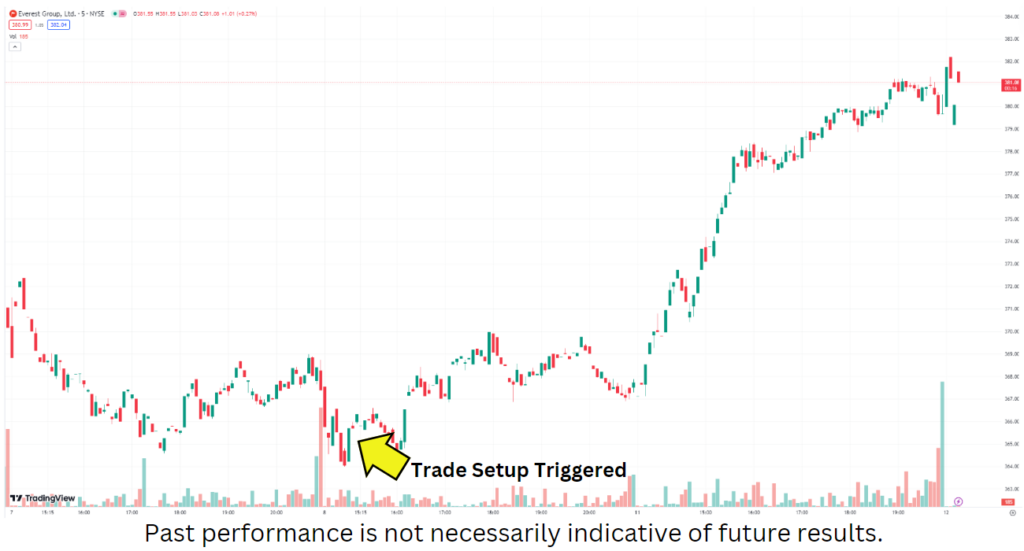
It moved accordingly with the A.I.’s calculations – marking 13 winning trades the last 17 times the Bullish Burst setup was triggered in EG.
Long Strangle Technical (Intermediate)
The next trade setup we’ll look at is a little more complex – hence, its placement in the “Intermediate” tier.
The Long Strangle Technical trade setup is ideal for trade ideas in stocks that look poised for potentially substantial price movements in either direction…but show no clear indication on which way they could move. This trade setup involves buying out-of-the-money option calls and puts in a stock that both have the same expiration date. The call and put options must respectively have a strike price above and below the stock’s current market price. This trade setup is designed to potentially profit from a huge price swing, regardless of what direction the stock moves.
The A.I. found this trade setup triggered in McDonalds (MCD)…
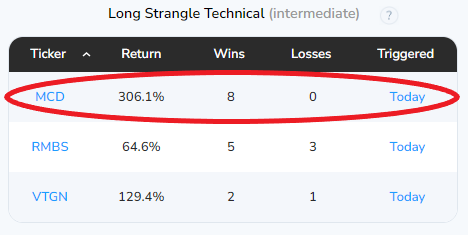
According to its analysis, MCD produced eight winning trades in as many times that the Long Strangle setup was previously triggered. It also shows you could have potentially netted cumulative returns over 306% if you traded MCD in all these instances.
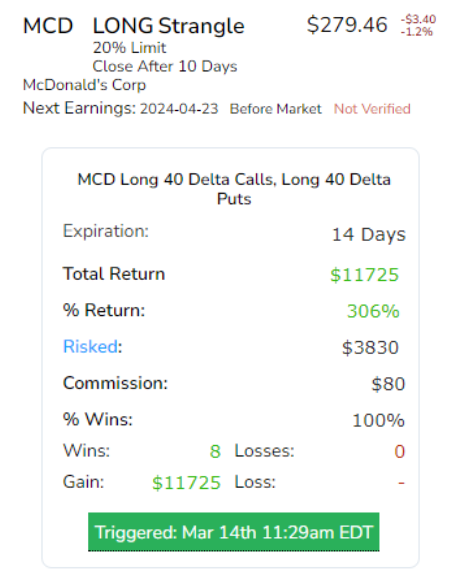
Unlike our Bullish Burst example, the A.I. is suggesting narrower potential profit margins for this trade. It says you should consider taking in potential profits at 20%. Despite the 14-day expiration, the A.I. also recommends closing this trade after 10 days.
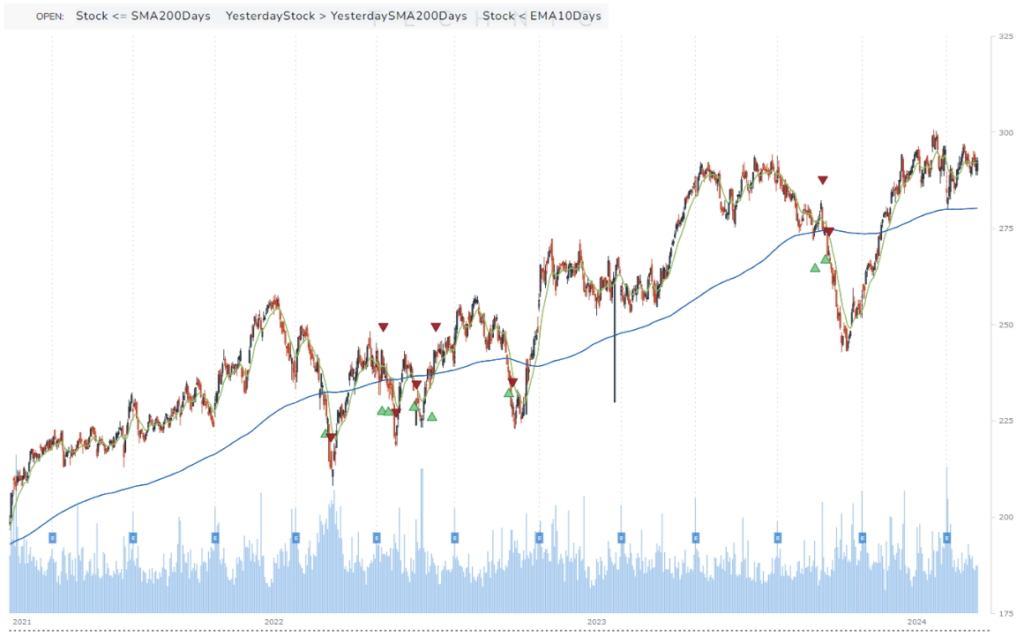
This chart shows all eight times the Long Strangle setup was triggered in MCD. Unlike our first example, the setup doesn’t necessarily jump out at you on a stock’s chart. This is why technical metrics play an important role in verifying these more elaborate trade setups. Let’s clarify each of the Long Strangle setup’s technical requirements…
The stock price must be below the 200-day SMA.
The previous day’s stock price must be above its previous day’s 200-day SMA.
The stock price must be below the 10-day EMA.
Here’s how MCD moved after the Trade Finder spotted this triggered trade setup…
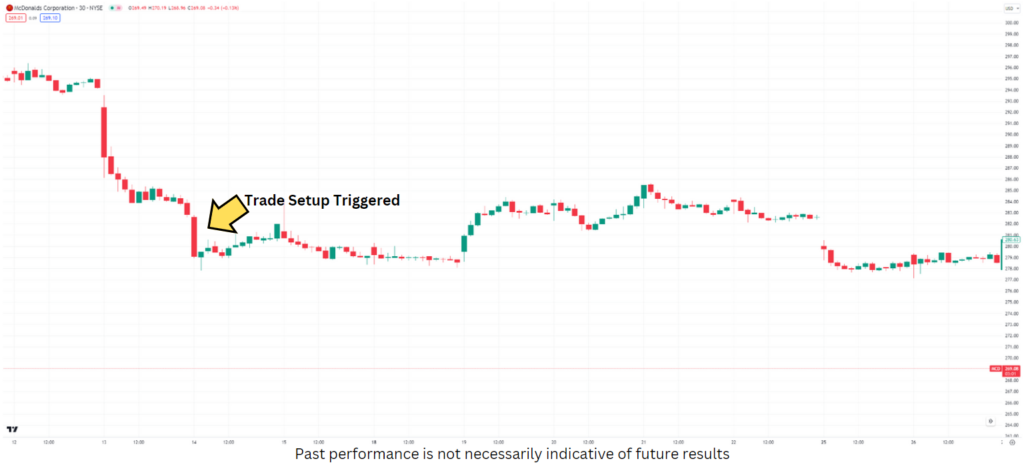
The Long Strangle setup was triggered after MCD plummeted. If you took the Trade Finder’s suggestions, and set this play up correctly, you could have potentially profited off MCD’s subsequent movement within the recommended 10-day timeframe.
MACD Momentum (Advanced)
Trade setups the A.I. labels as “Advanced” are ideally suited for your most experienced traders. One advanced trade setup Charlie follows is the MACD Momentum. As its name suggests, this trade setup utilizes the Moving Average Convergence Divergence (MACD) indicator to capitalize on potentially explosive trade opportunities, based on momentum changes.
The MACD indicator consists of two lines – the MACD Line and Signal Line. The MACD Line is calculated by subtracting the 26 and 12-day EMAs. The Signal Line is typically a 9-day EMA of the MACD Line. The A.I. looks for crossovers between these two lines that indicate bullish or bearish movement. When the MACD Line crosses above the Signal Line, it usually signals bullish momentum, and vice versa.
The Trade Finder is tailored to primarily look for bullish momentum plays with this indicator. Here’s a MACD trade setup the A.I. found that was triggered in PVH Corp (PVH)…
Although the number of winning trades aren’t as abundant like we saw in our previous examples, the A.I. says you could have potentially netted over 390% cumulative returns off these four stock plays in PVH.
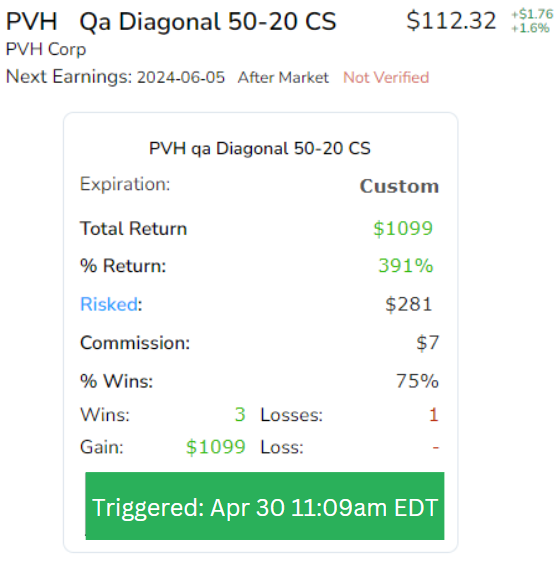
This section sheds light on the complexity of these trade setups. The A.I. suggests setting using a diagonal call spread to set up your trade. The “50-20 CS” translates to allocating your trade using 50 (at-the-money) long calls, and 20 (out-of-the-money) short calls that respectively have 60 and 30-day expirations.
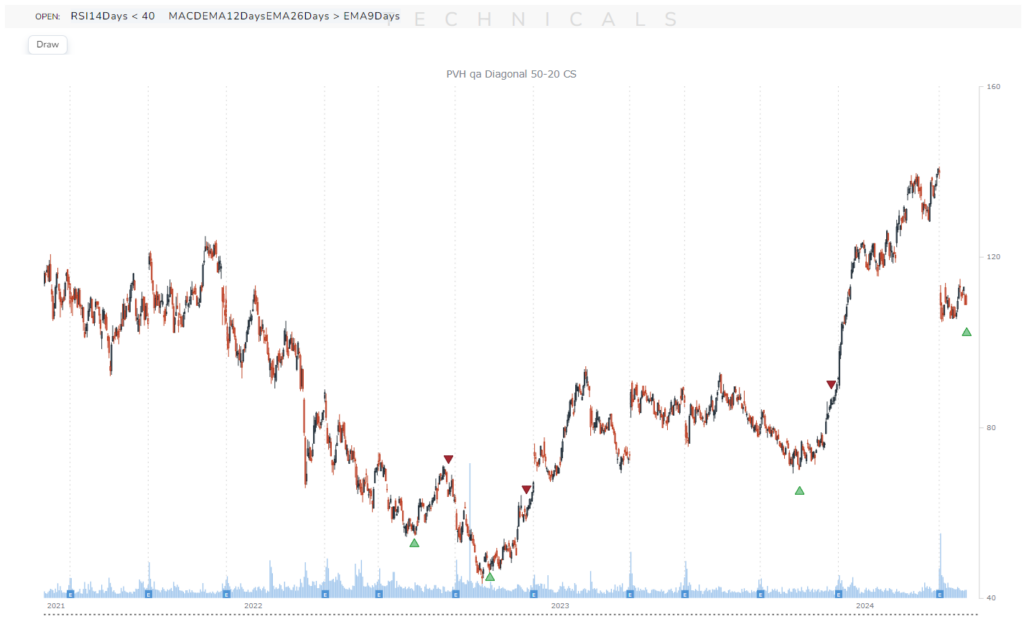
The chart shows this trade setup ideally gets triggered when the stock finds key support after a steep price drop, and is expected to undergo a subsequent reversal. Let’s break down this trade setup’s technical requirements…
The stock’s 14-day RSI must be below 40.
It also reiterates the MACD Line (MACDEMA12DaysEMA26Days) must be above the Signal Line (EMA9Days).
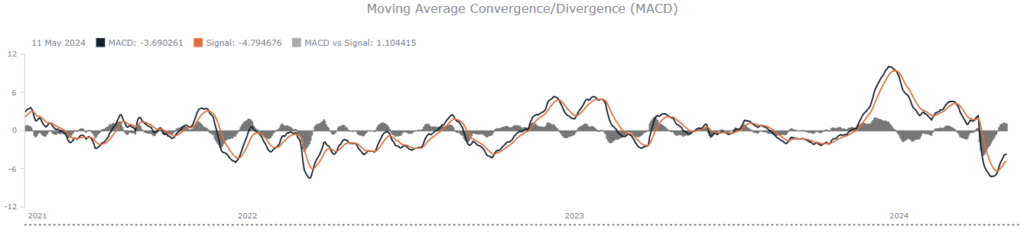
This section also provides a chart of the MACD Indicator to confirm this last technical metric. As you can see, it shows the MACD Line crossed above the Signal Line prior to the trade setup getting triggered in PVH.
Let’s see what PVH wound up doing after the Trade Finder spotted this triggered setup…
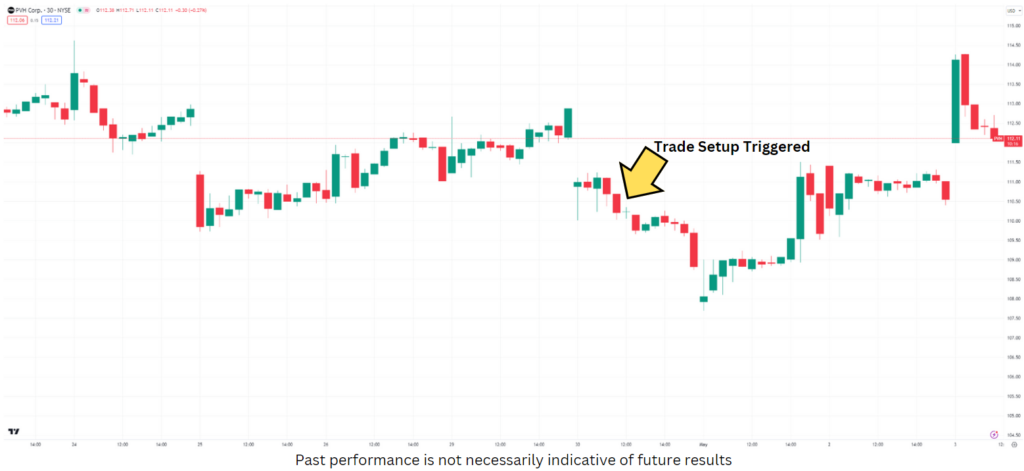
There you have it – PVH made a quick bounce off the support it found and capitalized off its bullish momentum.
If you’re interested in following some of the stock plays Charlie’s A.I. Trade Finder uses triggered trade setups to spot, he started sending 1-3 potentially explosive trade ideas it identifies every day. Click here to start getting your free daily A.I. trade suggestions.
Conclusion
Trade setups are one of the most detailed and accurate ways for finding high-profit potential stock plays. However, the technical calculations required to confirm their presence in a stock are above way too many traders’ heads. A.I. technology – like Charlie Moon’s Trade Finder – overcomes this obstacle by dynamically making all the technical calculations. It then uses historical data to highlight which stocks with triggered trade setups have the highest odds of making potential winning plays.
- Accessibility: A.I. technology is capable of cataloging the triggered trade setups it finds by classifying them into three tiers, based on ease of use.
- Corroboration: To back its findings, A.I. trading tools highlight the highest-profit potential trade setups triggered in stocks using historical data.
- Validation: Each triggered trade setup is confirmed by listing their technical requirements, and the indicators to ensure they’ve been satisfied.
Before you start using A.I. technology to find these high-profit potential trade setups, it’s important to remember that each one is uniquely designed. The technical metrics and strategies one A.I. potentially uses to identify triggered trade setups might be totally different from others you consider. Make sure to do your research before committing. Always understand how each A.I. platform fits your trading style, and the goals you’re looking to potentially accomplish.