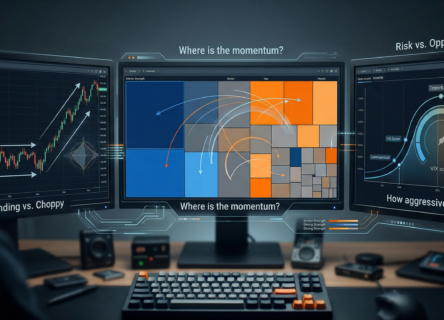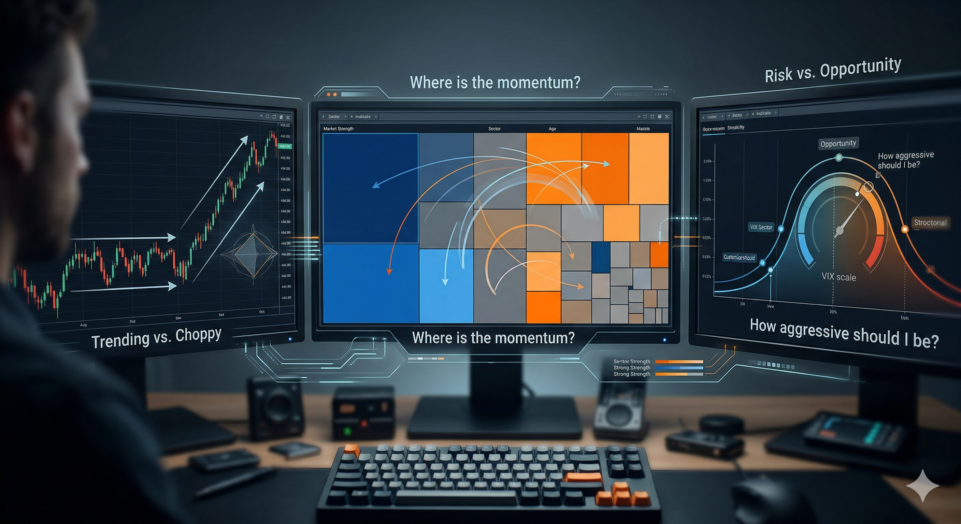
In this current market, I believe day traders should ask themselves three important questions:
- Is the market trending or choppy?
- Where is the momentum?
- How aggressive should I be?
The answers won’t jump out at you…and in conditions like these, finding them is no easy task. In my years of experience, I’ve learned that day traders should try leveraging every possible resource at their disposal. While risk management and a structured system are crucial, they’re only part of the equation.
A lot of day traders think that as long as they have a general awareness of market conditions — and the driving forces behind them — the only charts they have to focus on are the stocks they’re trading.
I personally believe this approach could be dangerously misleading.
For the most part, individual stocks don’t move on their own. They tend to follow the broader market, and react to overall sentiment. That’s why there are a few key charts I monitor regularly during market hours.
Sometimes they matter just as much (if not more) as the stocks I’m following.
There are three particular charts I closely watch that give me a clearer sense of market conditions, movements, and overall sentiment. I’ll explain what each one is, the data they show, and how they can help day traders answer those three key questions.
SPDR S&P 500 ETF Trust (SPY)
The SPY ETF tracks the S&P 500 Index. Its primary purpose is to mirror the performance (in both price and yield) of the 500 leading large-cap U.S. companies across all stock market sectors.
In layman’s terms, the SPY is used as a way to monitor the health and direction of the overall U.S. stock market. It provides a real-time view of how the “average” large-cap stock is performing.
When the SPY is moving, it usually means the broader market is likely following suit.
For day traders, I believe the SPY is essential because it can set the tone for each trading day. Like I mentioned earlier, most stocks usually don’t move independently. They follow the broader market.
If the SPY is trending higher, long (or bullish) setups tend to provide more fruitful results. Vice versa if market conditions are weak or choppy.
The SPY can help day traders answer all three key questions.
First, it shows if the broader market is trending or stuck in a specific range.
Second, it can signal momentum strength — is it strong or fading?
Finally, it can help day traders consider being more aggressive, or take a more calculated approach.
Think about it like this: Strong market trends could allow for bigger sizing, while choppier conditions might signal a more cautious approach.
Invesco QQQ Trust (QQQ)
QQQ is another ETF that tracks the Nasdaq-100, which is heavily weighted toward tech and growth stocks. It tracks the 100 largest non-financial companies listed on the Nasdaq.
While it doesn’t track the broader market (like the SPY), it’s a reliable measuring stick for U.S. large-cap growth stocks. It’s heavily concentrated in the tech sector, but also includes stocks from companies in consumer services, healthcare, and industrials.
Names like Apple (AAPL), Microsoft (MSFT), and Nvidia (NVDA) dominate this index, making it one of the market’s most active and volatile charts.
For day traders, QQQ is where a lot of the action happens. It often leads the market, especially during high-volatility periods. If QQQ is pushing strongly in one direction, it can signal where momentum is flowing across the board.
I believe QQQ is especially useful for identifying momentum. It can help day traders see where the strongest moves are developing, and if buyers or sellers are in control. It could also help gauge aggressiveness. When QQQ is trending cleanly, day traders can press trades more confidently.
In fact, I regularly release live trade signals for QQQ in my room throughout the trading day. If you’re interested in seeing how the options day trading system for finding them works, check out this cheat sheet I made with all the details.
CBOE Volatility Index (VIX)
Often called the “Fear Gauge,” the VIX measures market volatility. It calculates this metric by measuring Implied Volatility (IV) in S&P 500 options, and provides an outlook for these conditions over the next 30 days.
The VIX measures expected market volatility on a numerical scale that’s composed of three main sections:
- Anything below 15-20 usually indicates low volatility and satisfactory market sentiment
- Readings between 20-30 tend to signal moderate volatility
- Anything above 30 points to high levels of volatility and fear among investors
I believe the VIX is a critical indicator for day traders, because it can shed a lot of light on current market environments.
To reiterate, a rising VIX usually means faster, more unpredictable price swings. A falling VIX suggests smoother, more stable trends.
The VIX directly answers how aggressive you should consider being when trading.
High VIX environments could offer bigger day trading opportunities — but also higher risk.
Low VIX environments often favor cleaner setups, but smaller ranges. It can also help determine if the market is likely to trend or chop, giving day traders a clearer sense of how to consider approaching the trading day.
Final Takeaways
Successful day trading isn’t just about picking the right stock. In my opinion, it’s more about understanding your trading environment. The market leaves clues — if you know where to look.
By consistently tracking charts for indices and indicators like the SPY, QQQ, and VIX, day traders can get a clearer, informed, and more objective view of what’s actually happening beneath the surface.
These three charts work well together to help answer those three crucial questions:
- Is the market trending or choppy?
- Where is the momentum?
- How aggressive should I be?
When you combine the insights these three charts provide, they can help you make day trading decisions based on context and data, not guesswork and gut feelings.
From there, you can get a better sense of which day trading strategies to consider putting into action, and what stocks to follow.
Remember: In markets like these, having that anticipated edge can make all the difference.
I combine these charts with a powerful system for day trading options that helped my trade signals show over 189%* results in 2025, and hit triple-digit figures every year since 2020!
If you’d like to find out how it works — and the 5-7 stocks I mainly follow during market hours — I made this free cheat sheet that lays out everything you need to know.