Make no mistake…day trading options can be very profitable, but it can also be very risky.
If you don’t know what you’re doing—you will get burned.
When I first started day trading options, I learned that lesson the hard way quite a few times, but those experiences made me a better trader and coach.
I’ll be the first to tell you that as a day trader, you’re not going to win 100% of your trades. If anyone tells you otherwise, head for the hills!
If you want any chance of success, preparation is key. Don’t start day trading without having a plan in place:
- Do your research
- Set your goals and respect your risk parameters
- Find strategies that best fit your day trading style
These principles helped me develop a powerful three-step system for day trading options that helped my Live Trade Signals show triple-digit results every year since 2020 (including 2025).
My options day trading system is designed to achieve one goal: Potentially hit your daily profit targets in under 1 hour.
Each step is pretty straightforward. There’s no complex arithmetic involved, and you don’t have to worry about using any complex options setups. My system looks for three important details:
- Figuring out which direction a stock is expected to move
- Targeting potential returns up to 30-50%+ in under 1 hour
- Setting up your trades on ‘autopilot’ to spend less time trading each day
Every step of my options day trading system is centered around following a specific set of tools and resources called indicators.
What Are Indicators?
In short, indicators are mathematical calculations plotted on stock charts that use historical data to generate signals, identify trends, gauge momentum, and anticipate future price movements. These tools can help traders make more informed decisions about which stocks to consider watching, ideal times for making trades, and managing risk.
There are hundreds of different indicators for day trading options that have a variety of purposes. For the most part, trading indicators can be divided into four main categories:
Trend Indicators: Calculate which direction a stock is expected to move
Momentum Indicators: Measure the speed and strength of changes in a stock price
Volatility Indicators: Gauge the degree of price fluctuation in a stock price
Volume Indicators: Analyze how often a stock is being traded within certain timeframes
In my 30+ years of day trading options, I’ve used more indicators than I can remember…but there are three in particular that I believe every day trader should know. I’m going to share three of my top day trading indicators, explain how each one works, and why I believe they can give options traders a huge potential edge.
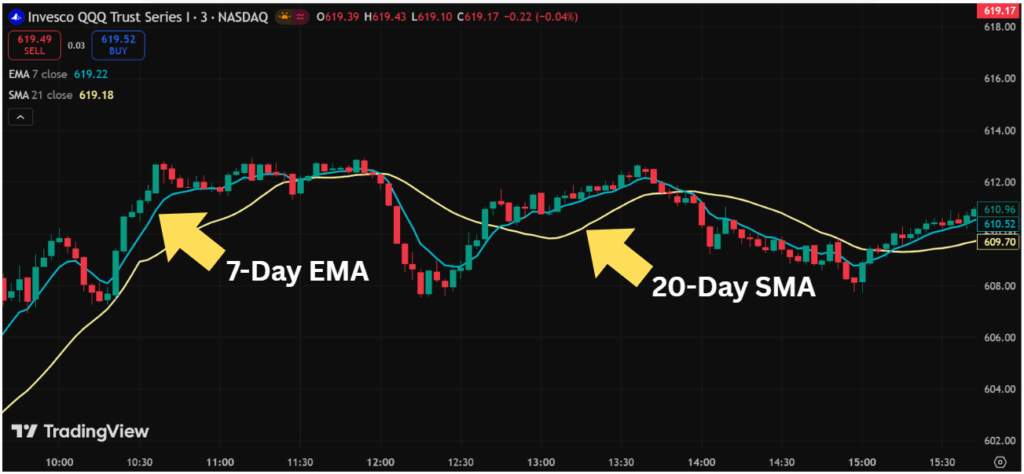
The 7-Day EMA vs The 20-Day SMA
Before I get into the specifics, let’s first explain what these indicators are and how they work:
Simple Moving Average (SMA): The Simple Moving Average is a trend indicator that calculates a stock’s average price over a specific timeframe. It gives equal weight to each data point, creating a smoother line that helps traders identify the overall trend, and key support or resistance levels without reacting too quickly to short-term noise.
Exponential Moving Average (EMA): Unlike Simple Moving Averages, Exponential Moving Averages calculate a stock’s average price over specific timeframes, but give more weight to the most recent prices, allowing it to react faster to price changes. Since it responds quickly to momentum shifts, traders often use EMAs to spot short-term trend changes and early entry or exit signals.
For day trading options, I like to follow the correlation between the 7-day EMA and 20-day SMA. To clarify, both moving averages show a stock’s average closing price within those specific timeframes.
Past Performance Is Not Necessarily Indicative Of Future Results
I believe the relationship between the 7-day EMA and 20-day SMA can be especially powerful for day trading options. When identifying bullish trade opportunities, I look for these two details:
- The 7-day EMA is above the 20-day SMA
- The stock price is holding above both moving averages
This often signals strong bullish momentum.
You can also use these two indicators to identify potential bearish trade opportunities. For example, when the 7-day EMA crosses below the 20-day SMA and the stock price stays beneath them, it may indicate weakening momentum or a trend shift. Traders often watch these crossovers (or rejections) as confirmation before entering fast-moving options trades.
These two moving averages also help with timing and risk management. The 7-day EMA can act as a tight trailing guide for entries and exits, while the 20-day SMA often serves as a more meaningful support or resistance level. Using them together allows options traders to stay aligned with the dominant trend, while still reacting quickly enough to capture short-term price moves—an essential balance when trading instruments that decay quickly like options.
I’m covering how my go-to system for day trading options uses EMAs in a free live training tonight at 8 PM ET. I’m revealing the role EMAs play to help me figure out which direction a stock is about to potentially move. If you’re interested in attending, check out this page for more information.
The VWAP 2-Standard Deviation Envelope
This indicator setup is a trading framework built around the VWAP (Volume Weighted Average Price), with bollinger bands plotted above and below, based on two standard deviations. There are three main pieces to this setup:

Volume Weighted Average Price (VWAP): This indicator represents the average price a stock has traded at throughout the day. It’s weighted by volume, making it a key reference point for institutional activity.
Bollinger Bands: These technical indicators are made up of a moving average with upper and lower bands, with a set number of standard deviations plotted above and below the stock price. The bands expand when volatility increases and contract when volatility decreases, helping traders identify when price may be stretched or compressed.
2-Standard Deviation: In day trading, the 2-standard deviation acts like a volatility range, showing how far the stock price has stretched away from “fair value” during the session. For context, the 2-standard deviation represents the range a stock typically trades 95% of the time. Whenever the stock price moves out of these ranges, it signals an abnormality, which could indicate the stock is poised for a major move.
For day traders—especially options traders—this setup helps identify high-probability mean reversion and momentum opportunities. When the stock price pushes into the outer standard deviation bands, it often signals an overstretched move that may stall, reverse, or consolidate.
Conversely, strong price acceptance outside the bands can indicate expanding momentum, offering potential continuation setups. This context is crucial for timing entries and exits, particularly in fast-moving markets.
In options trading, precision matters because time decay and volatility shifts can quickly impact profit potential. The VWAP/2-Standard Deviation Envelope helps traders align their strategies with intraday structure—whether targeting quick scalps, fading extremes, or riding momentum. By anchoring trades around where volume is concentrated and volatility is expanding or contracting, traders can better manage risk, improve timing, and avoid chasing emotionally driven moves.
This indicator setup plays a key role in my 3-step options day trading system. I’m holding an in-depth walkthrough on how it works tonight at 8 PM ET. Check out this page for more information on reserving a free seat.
Volume Profile
Volume Profile is a technical analysis tool that shows how much trading volume has occurred at specific price levels over a given period of time. By plotting volume horizontally on a chart, it highlights areas where the most buying and selling activity occurred.

Volume Profiles can help option day traders identify key levels such as the Point of Control (POC), Value Area High (VAH), and Value Area Low (VAL). Let’s break down what each of these mean:
Point of Control (POC): Shows where the highest amount of trading volume occurred during a specific session or time period. It represents the price the market found most “fair,” often acting as a magnet where price is likely to revisit or consolidate. In day trading, the POC frequently serves as a key pivot or intraday support/resistance level.
Value Area High (VAH): Marks the upper boundary of a stock’s price range, where approximately 70% of the total trading volume occurred. It often acts as resistance, when price moving above this level suggests the market could be exploring higher value. Option day traders can watch VAH closely to gauge potential breakouts or rejection points.
Value Area Low (VAL): This shows the range’s lower boundary that contains roughly 70% of the traded volume for a given period. It commonly functions as support, where buyers may step in if price revisits this area. A break below VAL can signal acceptance of lower prices and the potential for increased downside momentum.
To sum it up, these levels often behave like intraday support and resistance, providing clearer targets for entries, exits, and stop placement. When the stock price approaches these zones, options traders can better anticipate whether the move is likely to stall, reverse, or accelerate—crucial information when trading short-term contracts where timing and direction matter most.
Additionally, Volume Profiles can help traders align their options trades with market acceptance or rejection. Breaks away from high-volume nodes into low-volume areas can signal strong momentum and offer high-probability opportunities for directional options trades. Conversely, failure to move through these areas can hint at range-bound conditions, making premium-selling or mean-reversion strategies more attractive.
Conclusion
When it comes to day trading options, there are hundreds of indicators available. I believe the three outlined here—the 7-day EMA vs. 20-day SMA, the VWAP 2-standard deviation envelope, and Volume Profile—can give traders a uniquely powerful edge when used together.
Each one serves a specific purpose:
- Identifying Direction
- Improving Timing
- Defining Key Price Levels
More importantly, these indicators can help remove emotion from the day trading process. Instead of guessing or chasing moves, traders can rely on structure, probabilities, and repeatable signals—an absolute necessity when trading fast-moving options that are sensitive to time and volatility. While no indicator guarantees success, combining the right tools with proper preparation, discipline, and risk management can dramatically improve consistency and confidence.
If you’re serious about day trading options, understanding how a small set of high-quality indicators work—both individually and together—can be far more effective than jumping between dozens of tools.
Like I said earlier: I believe that preparation is key.
It’s what separates reactive traders from strategic ones, and these indicators provide a strong foundation for building a smarter, more efficient trading process.
My live training tonight at 8 PM ET emphasizes the importance of planning and preparation for day trading options. I’m showing how the indicators used in each step of my system play a vital role in finding high-profit potential option trades that can potentially help traders hit their daily profit targets in under 1 hour. If you’re interested in attending tonight’s live training, check out this page to reserve your free seat.