December 4, 2018

An Opportunity For Oracle

The rapprochement between President Trump and Xi Jinping fired up markets on Monday, but skepticism crept into investing sentiment overnight, weighing on equity markets. None of the commitments that U.S. officials said had been given by China were agreed to in writing, while there was initial confusion on when the three-month negotiating window would start. Meanwhile, the curve between the U.S. three-year and five-year and between two-year and five-year paper inverted on Monday for the first time since the financial crisis, and analysts expect the two-year, 10-year yield curve – seen as a predictor of a U.S. recession – to follow suit.

*Source:  Seeking Alpha

Let’s consider Oracle Corporation (Ticker: ORCL):

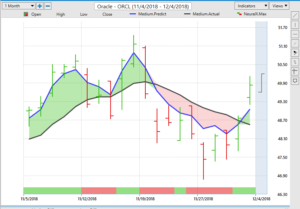
The VantagePoint platform recently indicated upside momentum.

Using the predictive indicators embedded within the VantagePoint platform and its predictive AI technology, we will point out three significant things. We have a bullish crossover indicated by the blue predictive indicator line crossing above the black simple moving average on November 30th.   We can combine that with the VantagePoint propriety neural index indicator moving from the RED to the GREEN position on the same day.  This indicator measures strength and weakness for a 48-hour period, in this case, strength.  The move to the GREEN position further makes the case for a potentially bullish scenario. We also have the predicted high and low above yesterday’s actual high and low indicating further weakness.  I want to play the VP bullish indication.

Strategy Discussion

If you are strictly a stock trader, simply buying ORCL in the $49.25 area is a prudent move.  You are anticipating a move to the upside.  It is always a good idea to enter a sell-stop order to mitigate potential losses.  Placing that sell-stop in the $48.00 area will achieve that goal.

For active traders with a shorter investment time horizon, you can consider a setup utilizing options. Given the market conditions outlined above, taking an active, premium debit approach may be the best path to success.

Because of the reasons given above, the purchase of a debit call spread may be one way to approach this situation.  You will first want to calculate your target strike.  In order to do this, you will need three pieces of data:  current price, expiration date and the implied volatility associated with that expiration date.  For ORCL, that yields a targeted strike of ~$51.00.  You may want to consider the ORCL Decembe4 14th weekly expiration 50/51 call spread, buying it for $0.30.  The most you can lose is the premium paid and the most you can gain is the width of the spread less any premium paid.  Max risk = $0.30 and max reward = 0.70.  This means that you are getting odds of 2.33:1.

Given the trading and market environment outlined above, a trader must evaluate whether this reward/risk ratio is appropriate for his/her risk tolerance.

If you would like to learn more about the VantagePoint platform and take advantage of the exclusive offer that our clients enjoy, please visit:

https://discover.vantagepointsoftware.com/prosper-demo/

about the author:

Mike Shorr

Since 1994, Michael has been an on-the-floor market maker, Vice-President of Interest Rate Derivatives for Knight Financial Products and Director of Education and Options Instructor at Trading Advantage. He makes the oftentimes complex world of options and trading accessible to the novice and advanced trader alike. Michael has a Bachelor of Science degree in Statistics and Finance from the University of Illinois Champaign-Urbana. He presently is Director, Trader Education at ProsperTradingAcademy.

Read Similar Articles

April 6, 2026

Q1 Earnings Season Preview: What To Expect

As we start a brand new quarter in 2026, it also resets the earnings cycle for companies to report their quarterly results — and I believe that Q1 Earnings Season could have a lot in store. Q4 earnings season at the start of the year gave traders a lot to process. It also set the […]

Read Article
April 3, 2026

March 2026 Jobs Report: The Good, Bad, & Unexpected

The March 2026 Jobs Report was among the most anticipated ones in recent memory. Right now, the economy is being shaped by a number of factors: These current circumstances — combined with February’s bad jobs report — had traders preparing for the worst. Fortunately, the March 2026 Jobs Report looked much better than expected…at least […]

Read Article
April 1, 2026

3 Charts Day Traders Should Follow

In this current market, I believe day traders should ask themselves three important questions: The answers won’t jump out at you…and in conditions like these, finding them is no easy task. In my years of experience, I’ve learned that day traders should try leveraging every possible resource at their disposal. While risk management and a […]

Read Article

Read Similar Articles

https://www.prospertrading.com/is-it-time-to-buy-msft/Is It Time to Buy MSFT?
April 13, 2026

Is It Time to Buy MSFT?

Like most tech names, Microsoft (MSFT) has seen a major decline in 2026. Since January, the stock was down over 24% at one point.   Although it’s made modest gains — climbing more than 7% — since hitting a new low in 2026, many traders are still wary. Mike Shorr covered this topic when he guest […]

Read Article
https://www.prospertrading.com/0dte-options-charlie-breaks-down-overnight-winner-in-avgo/0DTE Options: Charlie Breaks Down Overnight Winner In AVGO
April 10, 2026

0DTE Options: Charlie Breaks Down Overnight Winner In AVGO

On Thursday, Charlie Moon released his latest round of 0DTE options trade signals for his Thursday Blitz Program. A few of them were winners by Friday morning — +288%* in AMZN, +189%* in AMD… But his biggest results were in AVGO. Here’s the 0DTE options trade signal Charlie released: The results? A 552%* gain overnight! […]

Read Article
https://www.prospertrading.com/top-8-detractors-in-the-sp-500/Top 8 Detractors In The S&P 500
April 10, 2026

Top 8 Detractors In The S&P 500

The S&P 500 has faced some intense volatility in 2026. After falling more than 8% earlier this year, the index rallied over 7.5% since March 30th. While its resilience is noted, the underlying numbers show what’s really happening under the hood in the S&P 500. In reality, the index is largely influenced by a core […]

Read Article