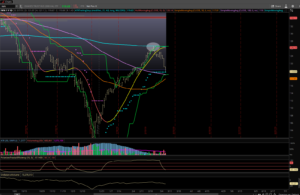
People always reference the small caps as being the leading indicator of market direction. I can see how that plays out at times. Unfortunately, now is one of those times. Just take a look at the screenshot I have. That teal blue line here I have circled is the 200-period SMA. A key level in any stock or ETF you track, this time it was a massive ceiling. The reaction off this level is been strong and we are starting to see the small-cap names washout. This is a risk-off period in the markets. I just hope this doesn’t continue to roll over into a full-blown sell-off. Keep a close eye on the IWN and use this as your potential market leading indicator.