Artificial Intelligence is helping options traders identify chart patterns in stocks that can give them a huge edge for finding potential high-profit stock plays. Some of these chart patterns seemingly hide in plain sight – because they require analyzing multiple layers of technical data to unveil. That’s where A.I. technology comes into play, helping traders find – and use – these patterns to make potential high-profit options trades.
How A.I. Finds “Hidden” Chart Patterns
Pro Trader Charlie Moon spent years successfully using chart patterns to find stocks that are poised for potential breakouts. After using an A.I. tool called the Trade Finder, however, Charlie says it helped him discover a deeper layer of these “hidden” chart patterns.
Charlie says these “hidden” chart patterns appear in the form of certain trade setups triggered in stocks. The Trade Finder spots these setups by making sure each one satisfies a checklist of specific metrics. In most cases, each one requires the stock price to be above or below a certain technical indicator – usually all at once, and within a specified timeframe.
Moon says these calculations would take most traders hours to do on their own before finding one of these triggered setups. The Trade Finder’s dynamic qualities help overcome this issue by simultaneously scanning thousands of stocks with hundreds of tools and indicators for triggered setups. Upon finding one in a stock, the Trade Finder tallies how many times it was previously triggered. The A.I. then uses this data to calculate a stock’s average win rate and cumulative returns from each time.
Charlie’s Trade Finder generates this information in about 60 seconds. The A.I. provides a degree of detailed proximity that’s nearly impossible for most options traders to find on their own (or at least with enough time to jump in on the potential trade opportunity).
Charlie started using these “hidden” chart patterns his Trade Finder spots to send out three potentially explosive stock plays every morning. Each one features the aforementioned historical data above – plus details on how to potentially make each trade. Charlie’s even doing this for free to help more traders get a taste of how well this A.I. trading technology works. For more information, click here to start getting Charlie’s three free daily stock play recommendations.
Main Takeaways
- A.I. technology is helping options traders uncover a “hidden” chart patterns by identifying trade setups triggered in stocks
- These setups must satisfy a specific set of technical requirements, and are nearly impossible for options traders to manually calculate
- A.I. tools identify these “hidden” chart patterns by calculating how the stock performed each time after one of these trade setups was previously triggered
What Does A.I. Tell Us About “Hidden” Chart Patterns?
A.I. technology like the Trade Finder can spot dozens of the market’s highest-profit potential trade ideas every day in about 60 seconds. By analyzing a stock’s performance after each triggered trade setup, the A.I. calculates its track record (ie its “hidden” pattern). It reveals how likely the stock is to potentially make a winning trade, by highlighting their average win rate and cumulative returns.
Check out this example that recently happened in Everest Group (EG)…
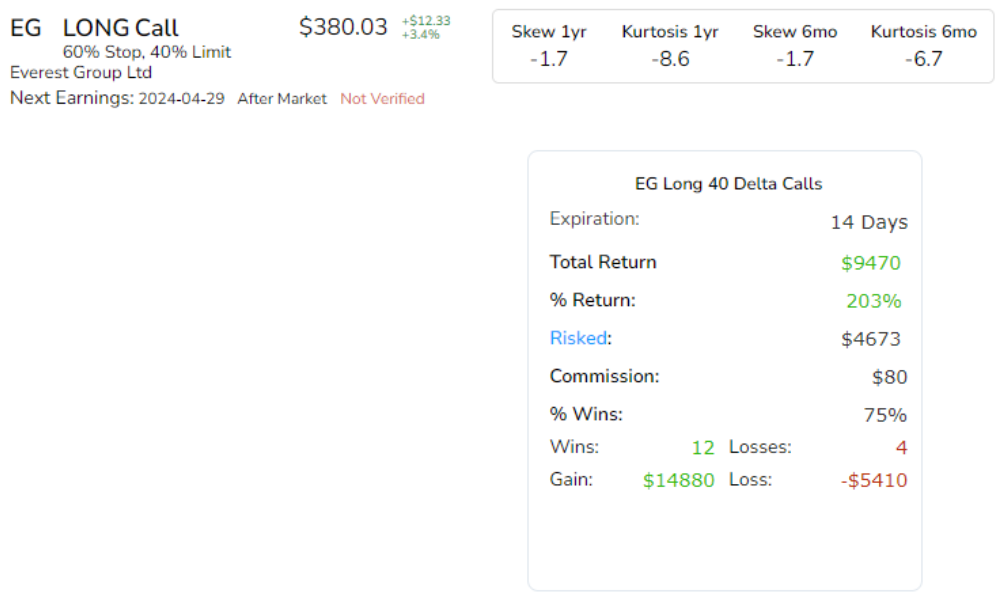
The Trade Finder identified a “Bullish Burst” setup that was triggered in EG on March 8…
This section reveals two important details…
How the stock performed each time after this setup was previously triggered…
And Instructions on how to potentially trade EG off this triggered setup.
In this most recent case, the Trade Finder expects EG to keep rising. Because of this, it says you should consider trading long calls.
If you followed these specific instructions, you could have potentially made 12 winning trades and four losing ones – a 75%* win rate – the last 16 times a “Bullish Burst” setup was triggered in EG. It also shows you would have potentially netted 203%* cumulative returns off those 16 previous stock plays.
To clarify, this information establishes a recurring pattern making potential-high profit options trades whenever the “Bullish Burst” setup was previously triggered in EG…
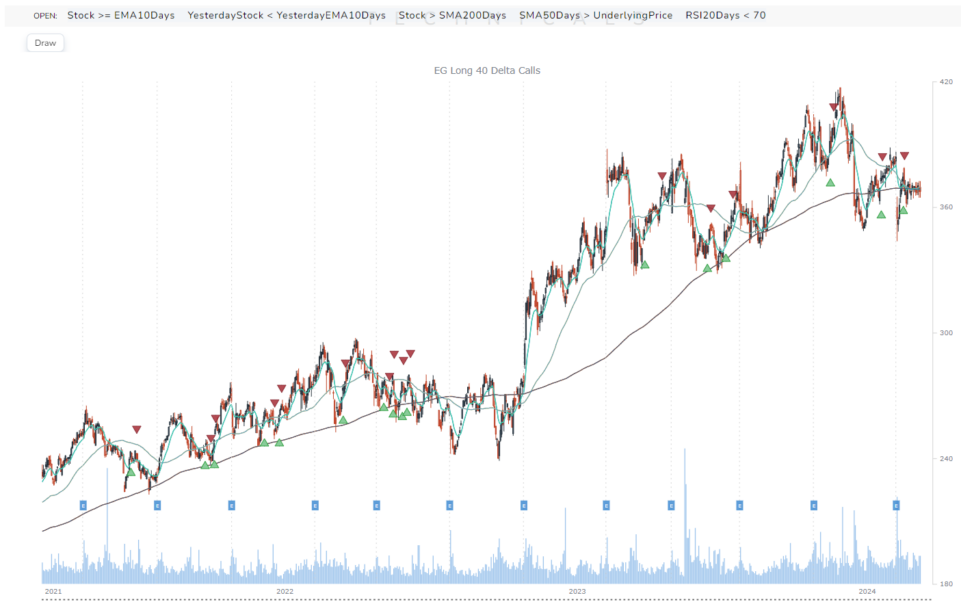
But the Trade Finder doesn’t stop there, and goes another step further. It also generates a visual of this “hidden” chart pattern that the “Bullish Burst” trade setup formed in EG…

This chart shows how EG moved after all 16 times after the “Bullish Burst” setup was previously triggered.
The green arrows show each time a “Bullish Burst” setup was first triggered in EG – and where you would consider buying. The red arrows show where you would have been recommended to exit each trade.
Let’s redirect our attention to that gray bar above the chart. This section reveals each technical requirement for triggering the “Bullish Burst” setup. Think of these metrics as your checklist to confirm it was triggered in the stock. They’re like the building blocks that help form each unit of this chart pattern. In this case for the “Bullish Burst” setup, here’s a straightforward explanation for each technical requirement…
The stock must be above or equal to the 10-day Exponential Moving Average (EMA).
The previous day’s stock price (before the day it was triggered) must be below the previous day’s 10-day EMA.
The stock must be above the 200-day Simple Moving Average (SMA).
The 50-day SMA must be above the underlying stock price.
The Relative Strength Index (RSI) must be greater than 70.
To reiterate, every time these technical metrics all happened at once, it means the “Bullish Burst” trade setup was triggered in EG.
Now that we explained how the A.I. uses triggered trade setups to identify these chart patterns, let’s see how EG wound up moving…
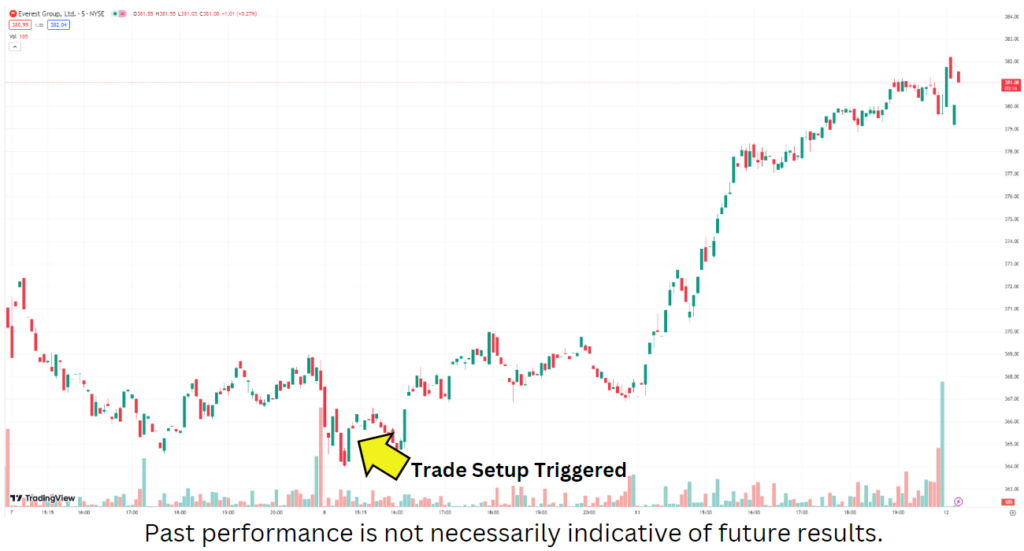
As you can see, EG added to the “hidden” pattern Charlie’s Trade Finder spotted! That marks 13 potential winning trades you could have made the last 17 times after a “Bullish Burst” setup was triggered in EG.
If you want to start getting these kinds of potential winning options trade ideas, Charlie started sending three free potential high-profit stock plays that his Trade Finder spots every day. Click here for more information on how to get your free daily option trade recommendations.
Conclusion
The market is filled with layers of “hidden” chart patterns that can dramatically raise your chances of finding potentially explosive option trades. Some of these chart patterns seemingly hide in plain sight, and are almost impossible to identify on your own in a timely manner. A.I. tools like Charlie Moon’s Trade Finder can be very effective at dynamically making these calculations – allowing you to potentially jump in on these trade opportunities at the most ideal times.
- Identification: A.I. technology is capable of finding potential winning trade opportunities by identifying specific chart patterns using triggered trade setups.
- Calculation: Instead of wasting hours making these calculations on your own, A.I. technology can do them in about 60 seconds with unrivaled accuracy.
- Timeliness: By dynamically identifying these chart patterns with A.I., it gives you chances to jump in on these trade opportunities at ideal times.
Remember that each A.I. platform is uniquely designed, and has different ways of finding potential high-profit trade opportunities. Always do your research before committing to using any platform, so you make sure it aligns with your specific trading style and goals.


