
July 4, 2019

POC Vs. VWAP…Is There A Difference?

The POC (Point Of Control) and VWAP (Volume Weighted Average Price) are two technical indicators used by traders.  Many traders use the terms interchangeably, but is it correct to do so?  No, it is not correct to equate the two indicators.

Both represent where the most trading occurred.

The VWAP relates to volume.  It is the PRICE at which the most VOLUME traded for a specified timeframe.
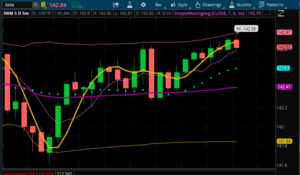
The thicker purple line represents the VWAP in the chart above.

The POC relates to time.  It is the PRICE at which trading spent the most TIME at.
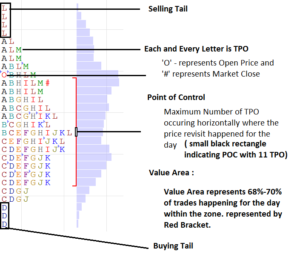
Very often people confuse time with volume and think that the price the market traded at the longest would have the most volume, but this is a misconception. Especially when looking at 24-hour charts, the POC does not necessarily mean the highest volume price. If only viewing the day session, many times the POC and VPOC are very close or the same, but not always.

For day trading in our Short-Term Options Room, we use the VWAP.

 

about the author:

Mike Shorr

Since 1994, Michael has been an on-the-floor market maker, Vice-President of Interest Rate Derivatives for Knight Financial Products and Director of Education and Options Instructor at Trading Advantage. He makes the oftentimes complex world of options and trading accessible to the novice and advanced trader alike. Michael has a Bachelor of Science degree in Statistics and Finance from the University of Illinois Champaign-Urbana. He presently is Director, Trader Education at ProsperTradingAcademy.

Read Similar Articles

https://www.prospertrading.com/mike-shorr-qa-090326/Mike Shorr’s Live Q&A: Managing an Unexpected Rally
September 5, 2026

Mike Shorr’s Live Q&A: Managing an Unexpected Rally

Mike Shorr sat down for another live Q&A with his trading room, and this one gets into the numbers most traders never share. His current swing positions, why he leans on one specific ticker, and exactly what his winners look like next to his losers.

Read Article
https://www.prospertrading.com/scott-bauer-ikbr-podcast-090226/Scott Bauer and IKBR: Rate Hikes, Sector Rotation, and AVGO
September 4, 2026

Scott Bauer and IKBR: Rate Hikes, Sector Rotation, and AVGO

Scott Bauer joined the IBKR Podcast this week to break down what conflicting economic data means for investors, where the smart money is rotating, and what Broadcom’s report tonight could signal for the rest of the market.

Read Article
https://www.prospertrading.com/scott-bauers-dell-090226/Fading the Rally: Scott Bauer’s Iron Condor on DELL
September 2, 2026

Fading the Rally: Scott Bauer’s Iron Condor on DELL

Scott Bauer joined Schwab Network to walk through the iron condor he is selling to take advantage of the post-earnings volatility in Dell and shared his read on the daily sector rotation that is making this market so difficult to navigate right now.

Read Article

Read Similar Articles

July 15, 2026

The Fed, Oil, and What Earnings Season Really Means

Scott Bauer joined the IBKR Podcast this week to break down what moved markets last week and what investors need to watch heading into the next stretch of earnings season. From lagging inflation data to big tech CapEx concerns, Scott did not hold back.

Read Article
July 5, 2026

The Week Ahead: Happy 250

The Dow rose more than ​1% to a record closing high on Thursday ahead of the long holiday weekend as a softer-than-expected U.S. ‌jobs report eased worries about interest rate hikes, while another sharp drop in chipmaker stocks weighed on the Nasdaq. The second half of 2026 kicked off this week much the same as […]

Read Article
June 28, 2026

The Week Ahead: Darn Inflation

A renewed sell-off in technology stocks grabbed headlines this week. The Nasdaq index fell 4.5%, closing lower 5 days in a row, led by a large 5.5% decline in the so-called Magnificent 7 mega cap names. Meanwhile, the post IPO exuberance around SpaceX appears to be fading, with shares now down 25% from their peak. […]

Read Article