

Financial markets remain locked in a rolling correction, defined by a volatile reassessment of the “higher-for-longer” interest rate environment, as investors continue to navigate shifting geopolitical headlines, elevated bond yields, and mixed economic data.
At the center of market unease remains the evolving situation in the Middle East. While tensions involving Iran continue to disrupt sentiment and inject volatility into global markets, a temporary pause announced by President Donald Trump—extending through April 6—has provided zero relief. The market response suggests that traders remain skeptical that the current reprieve will produce a durable de-escalation. Instead, investors appear to be pricing in the possibility that hostilities could re-intensify at any time, particularly over the weekend when headlines can emerge outside of market hours and force sharp repricing by Monday’s open.
U.S. stocks tumbled on Friday, with each of the three major U.S. indexes closing at their lowest levels in over seven months and the Dow confirming it was in correction territory as the month-long Middle East war continued to suppress risk appetite.
Selling snowballed in the week’s final session, capping the biggest two-day slide in the S&P 500 since last year’s tariff dramas. The Dow, S&P 500 and Nasdaq each suffered their fifth straight weekly decline, the longest such streak in nearly four years. Concern about the war’s impact on spending pushed consumer discretionary stocks down 3%, the worst drop in five months. Financial stocks, which had held up for most of the last two weeks, dropped 2.5%, while the Cboe VIX surpassed 30, the highest in almost a year.
The surge in oil prices along with other products such as fertilizer as a result of the Iran War has fanned inflation fears and dampened expectations that the Federal Reserve and other central banks have room to lower interest rates.
For the week, the Dow lost -0.9% to 45,167, the S&P 500 closed lower by -2.1% to 6,369, the Nasdaq gave back -3.2% to 20,948 and the Russell 2000 actually gained +0.5% to 2,450. The CBOE Volatility Index ratched up higher by 15.9% to 31.05.
Can We?

Both the Dow and Nasdaq have now slipped into correction territory, now more than 10% lower then their recent highs.
The Nasdaq 100 officially entered correction territory on Friday as the war in Iran drove the fifth straight week of stock losses. The tech-heavy stock index dropped 2% on Friday to around 23,138, its lowest level in about seven months. The index is down 11% from its all-time high of 26,119 in October, meeting the criteria for a standard stock correction.
The Dow Jones Industrial Average also entered correctional territory, losing 10% from its peak earlier this year and shedding more than 800 points on Friday. The Dow tumbled on Friday and fell into correction territory, while Brent topped $110 after incidents in the Strait of Hormuz exacerbated investors’ energy supply concerns.
The S&P 500 (not quite in correction territory), has now erased -$4.8 trillion in market cap since the Iran War began on February 28th. The S&P 500 officially posted its lowest close in 232 days, erasing another -$1 trillion of market cap on Friday. The S&P 500 officially fell below 6,400 for the first time since September 2025 which puts the S&P 500 just 90 points away from entering correction territory.
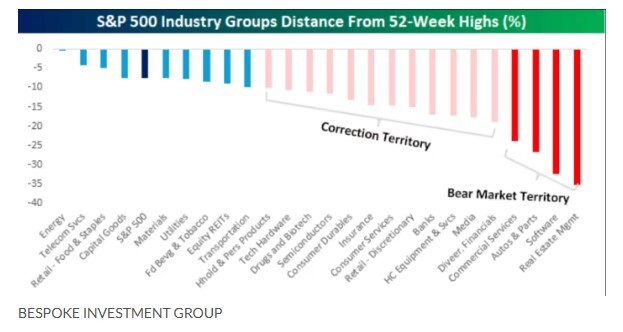
More than half of the S&P 500 industry sectors are in correction territory. As mentioned above, the S&P 500 is not quite there yet but how much longer until it may?
Bespoke Investment Group looked under the hood of the S&P 500 and into the performance of the index’s 25 industry groups. During the past week, 16 of them finished at least 10% below their 52-week intraday highs, according to Bespoke Investment Group. And four of those — real-estate management, software, autos and parts , and commercial services — have tumbled at least 20%, putting them in bear-market territory, Bespoke said in a note emailed to MarketWatch on Friday.
The chart above captures their performance. Real-estate management saw the biggest plunge among the industries, recently losing 35% of its value from its 52-week high, the chart shows. But the decline in software stocks had a bigger impact on the index, given the sector’s larger weighting. The industry group was down by “nearly a third,” Bespoke said.
As for the S&P 500’s 11 sectors, all but energy are in the red so far in March. Energy ended Friday on pace for a monthly gain of 12.5%, as U.S. oil prices hovered around $100 a barrel, according to FactSet data..

The Iran conflict has investors second-guessing one of the world’s crucial safe-haven assets, as markets are not pricing in any easing from the Fed this year, compared with expectations of two cuts before the conflict broke out, according to the CME FedWatch Tool. Markets are actually now pricing in approximately a 25% chance for a hike of at least 25 basis points at the Fed’s October meeting.
Multiple weak auctions in the $30 trillion Treasury market this week provide a glimpse into the growing anxiety in markets as the fighting in the Middle East enters a fifth weekend. The Treasury market just logged its worst share of poor auctions in a month in nearly three-and-a-half years. It seems like the last thing people are racing to do is to jump into any kind of fixed income — much less Treasurys — because the risk of inflation is ramping up.
The bond selloff has been driven not only by rising inflation expectations but also by a repricing of what central banks intend to do next, a shift playing out from Washington to Frankfurt to Tokyo.
Ten-year Treasury yields have jumped, poised for the largest monthly increase since October 2024. The selloff in bonds had the 10-year yield at 4.4% Friday, up from a brief dip below 4% in early March. The 2-year yield was at 3.9% after surging about 60 basis points over the same stretch, according to FactSet. Bond prices move in the opposite direction of yields.
The Treasury-market weakness comes as the U.S. needs $1 out of every $5 it receives in tax revenue to service the national debt, according to Apollo Global Management Chief Economist Torsten Slok. The U.S. also has $10 trillion of debt that needs refinancing over the next 12 months, Slok said in client notes this week.

Pain at the Pump
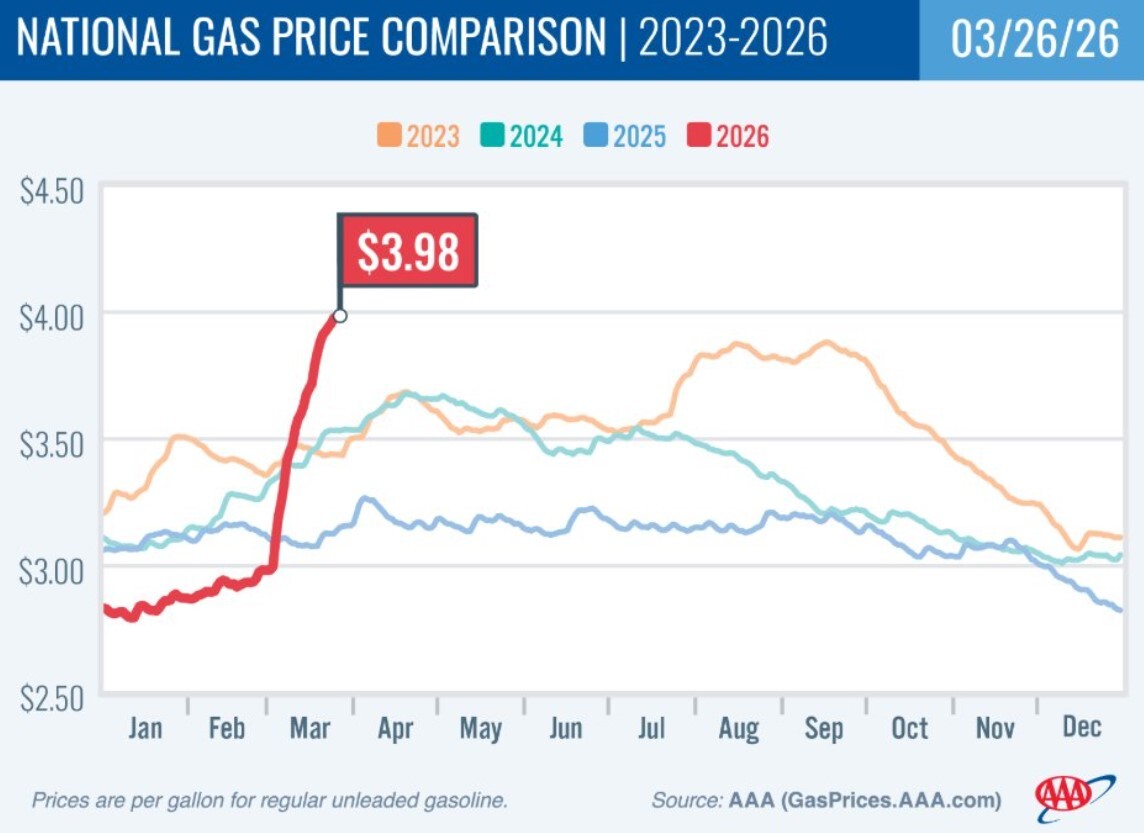
Gas prices are now up +$1.00/gallon since the Iran War began with mortgage rates nearing 6.50%, a 7-month high. At the current pace, we could see gas prices at $4.50+/gallon and 7% mortgages as soon as next month.
Gasoline prices could come in above the $4 average this week in the Department of Energy report scheduled for Tuesday, March 31. Trends have been painful for consumers at the pump, with costs rising for 10 consecutive weeks beginning on the seven-day period ending on January 19. The most recent publication delivered a headline of $3,961 and it’s very likely that we could cross $4.00 this week, marking the 11th print in a row of increases.
Economic Reports of Note (All Times EST):
Monday
9:00 am – US: Wholesale Inventories
10:30 am – US: Fed Chairman Powell Speaks
10:30 am – US: Dallas Fed Manufacturing Business Index
11:30 am – US: 3 & 6-month Bill Auctions
4:00 pm – US: FOMC Member Williams Speaks
Tuesday
2:00 am – UK: GDP
5:00 am – EU: CPI
8:30 am – CAN: GDP
8:55 am – US: Redbook
9:00 am – US: House Price Index
9:45 am – US: Chicago PMI
10:00 am – US: Conference Board Consumer Confidence
10:00 am – US: JOLTS
10:30 am – US: Dallas Fed Services Revenues
12:00 pm – US: Fed Member Goolsbee Speaks
1:00 pm – US: Fed Vice Chair Barr Speaks
Wednesday
7:00 am – US: Mortgage Data
8:15 am – US: ADP Nonfarm Employment
8:30 am – US: Retail Sales
9:45 am – US: S&P Global Manufacturing PMI
10:00 am – US: ISM Manufacturing
10:00 am – US: Business & Retail Inventories
10:30 am – US: Crude Oil Inventories
11:30 am – US: Atlanta Fed GDPNow
11:35 pm – JAP: 10-year JGB Auction
Thursday
7:30 am – US: Challenger Job Cuts
8:30 am – US: Weekly Jobless Claims
8:30 am – US: Trade Balance
11:00 am – US: Fed Member Logan Speaks
11:30 am – US: 4 & 8-week Bill Auctions
11:30 am – US: Atlanta Fed GDPNow
Friday – Markets Closed in Observance of Good Friday
8:30 am – US: March Nonfarm Payrolls
9:45 am – US: S&P Global Composite & Services PMI