

Stocks ended slightly mixed on Thursday after recovering from deep losses, as diplomatic signals from the Middle East helped calm markets rattled earlier by President Trump’s threats of tougher action against Iran. The three indexes had their biggest weekly rise in four months and the first week of gains in the last six. As war in the Middle East stretched into a fifth week, traders continued to react to Trump’s words as they would an economic data release or big corporate earnings report: buying and selling when they can with every new social-media post from the president, even when the post arrives outside market hours.
Front-month crude prices surged with WTI up 11% near $111/barrel. Brent crude rallied 7% near $108/barrel. (More on that below). However, traders priced it at about $82/barrel in October, a signal that they expect the disruption to be temporary.
Overall, Wall Street slipped back into a defensive posture as investors gave back part of this week’s powerful rebound and reassessed the geopolitical backdrop after President Trump’s address on Iran made clear that the conflict may intensify before it ends. (It sure seems to have escalated since the market closed on Thursday).
Treasury yields remained elevated and Bitcoin fell as speculative assets were back under pressure. Gold and silver also dropped reflecting a market that is increasingly focused on the inflationary consequences of war and the possibility that higher energy prices could keep rates restrictive for longer.
The bottom line is that markets are no longer trading on a simple war headline alone. They are trading on the interaction between war, inflation, rates, and growth. Until investors see either a de-escalation in Iran or clearer evidence that inflation will not be reignited by the energy shock, volatility is likely to remain the defining feature of this market.
For the week, the Dow gained +3% to 46,505, the S&P 500 rallied +3.4% to 6,583, the Nasdaq closed higher by 4.4% to 21,879 and the Russell 2000 added +3.3% to 2,530. The CBOE Volatility Index plummeted -23.1% to 23.87.
WTI HIGHER THAN BRENT

Backwardation in WTI futures suggest traders expect a ‘sooner-than-later’ Iran war resolution. Oil futures finished higher with U.S. oil taking the price lead over global oil for the first time in almost four years, after President Trump said the U.S. will hit Iran “extremely hard” in the coming weeks.
That fueled concerns about broader disruption in the global energy sector, even as Trump, during his address to the nation Wednesday evening, also provided assurances that the U.S. has nothing to worry about regarding oil and doesn’t need Middle East oil.
U.S. crude production is currently at around 13.6 million barrels per day and that’s a full 3 million barrels below the amount of oil the nation’s refineries process each day, said Tyler Richey, editor of Sevens Report Technicals. The “math doesn’t work,” he said.
Factoring in the 6.5 million barrels per day of oil imported from Canada makes a better “domestic oil independence case,” he said, but the U.S.’ aging oil-refinery system has been geared toward refining heavy crude oil imported from the Middle East since the mid-1990s — not the “mostly light, sweet crude oil lifted from below U.S. soil.”
“Put simply, we lift the wrong kind of crude oil for our own system and rely on foreign buyers or swap deals to make things happen in the energy world,” Richey said.
June Brent crude climbed 7.8% to settle at $109.03 a barrel, ending the holiday shortened week with a 3.5% gain, according to Dow Jones Market Data. U.S. benchmark West Texas Intermediate crude for May delivery rose 11.4% to settle at $111.54 a barrel — ending above Brent for the first time since May 18, 2022. It posted a weekly rise of 11.9%.
The WTI crude quote on the screen “inherently has a more immediate/pressing geopolitical-war premium priced in,” than the global June Brent contract, which recently became the front-month futures contract, said Richey. The June Brent contract has almost 30 extra days of “opportunity for [a] ceasefire” baked in.
That highlights a dynamic in WTI futures known as backwardation — a situation where current prices of oil are higher than prices of oil for later delivery.
It is clear that prices for contracts for delivery in months further out “rapidly compress back to a consensus ‘fair value’ target zone of roughly $67 a barrel, as you look out the duration curve towards the first half of 2027,” said Richey.
That tells us that the war and subsequent closure of the Strait of Hormuz is “viewed as being resolved sooner than later with physical market flows and seaborne oil logistics expected to normalize to pre-war levels” by late-2026 to early 2027, he said.
Still, Trump has offered mixed messages over the future of the conflict in the Middle East. In his address to the nation, he said the U.S. military operation in Iran was “very close” to concluding, while asserting that the plan is to “finish the job” and strike Iran “extremely hard” to bring the country “back to the stone ages.”
Even if the war ends, oil production can’t be quickly resumed and returned to normal because there’s been a lot of infrastructure damage, said Sasha Foss, energy analyst at CSC Commodities, a division of Marex. It’s “not like a light switch that you can turn on and off.”
There’s also an “elevated geopolitical risk premium of everyone fearing that Iran will control the strait for longer and they’ve shown that they can. It’s a pretty easy asymmetric war,” he told MarketWatch on Thursday.
Meanwhile, Esmail Baghaei, Iran’s Foreign Ministry spokesperson, said the Islamic republic “will not tolerate this vicious cycle of war, negotiations, cease-fire.” Tehran has repeatedly denied Trump’s claims that it has asked Washington for a cease-fire.
Trump’s signaling that the U.S. will intensify attacks over the next few weeks risks further damage to energy infrastructure, said Ryan Sweet, global chief economist at Oxford Economics. Added to a slower reopening of the Strait of Hormuz and declining supplies, it could lead to oil prices rising further by the end of the year as Sweet’s team keeps a $113 target on Brent crude for the second quarter, he said.

LOOKING UNDER THE HOOD

Did you ever fell like something just wasn’t right and you had to “check under the hood?”
The March 2026 Jobs Report was among the most anticipated ones in recent memory and right now, the economy is being shaped by a number of factors:
- The Iran Conflict
- Surging Oil Prices
- Interest Rate Uncertainty
- Mass Layoffs
These current circumstances — combined with February’s bad jobs report — had traders preparing for the worst. Fortunately, the March 2026 Jobs Report looked much better than expected…at least at first glance.
In reality, some of the key metrics it showed were relatively frontloaded…and a little misleading. The underlying numbers depict a more grounded reality that still points to a cooling labor market with capped momentum. From a trading perspective, the markets will likely view it as “better than feared” rather than a sign of renewed strength.
I’ll highlight the March 2026 Job Report’s positives, negatives, and which parts of the market I believe traders should consider watching.
The Good
Job Growth Shattered Expectations
One of the biggest surprises in the March 2026 Jobs Report was nonfarm payrolls, which showed an increase of 178,000. Not only did these numbers greatly exceed forecasts in the 60,000 range, but they showed a sharp rebound from February’s revised loss of 133,000. Wage growth remained steady, with average hourly earnings rising 0.2% month-over-month (3.5% year-over-year). The unexpected payroll spike signalled continued resilience in the U.S. economy, with inflation pressures tied to labor showing signs of stability.
Declining Unemployment
The March 2026 Jobs Report showed a slight decrease in unemployment, which fell to 4.3% from 4.4%. The total number of unemployed individuals declined by 332,000. This suggests the labor market is still holding firm, even as broader economic uncertainty lingers.
Solid Gains in Key Sectors
Looking under the hood, job growth was highly concentrated in a core group of sectors. Healthcare led the way with 76,000 new jobs, which was largely driven by the recovery from last month’s strikes. Other key sectors that experienced significant job growth included construction (+26,000) along with transportation and warehousing (+21,000). The gains in these sectors point to continued strength in infrastructure and logistics.
The Bad
Misleading Unemployment Numbers
The lower unemployment numbers were a huge positive…but they need some context. A big reason the unemployment rate declined is because roughly 396,000 people exited the workforce. This was driven by key factors including crackdowns on immigration and deportation efforts, an aging population, discouraged workers (ie, people who aren’t actively looking for employment), and economic uncertainty. It signals that fewer people are looking for work in an already-sparse job market, suggesting it’s not as strong as the headline numbers imply.
The Underlying Trend
While the March 2026 Jobs Report showed a headline rebound, the underlying trend still points to a slower-growth labor market. Even with March’s stronger print, the three-month average sits around 68,000 jobs. Those numbers are historically low, and suggest that hiring momentum has softened for much of the past year. To sum it up: One strong report doesn’t necessarily signal a sustained acceleration.
Job Growth Was Up…But Limited
Although job growth was much higher than expected, the March 2026 Jobs Report revealed some concerns beneath the surface. Like the unemployment figures, job growth metrics were also misleading to a notable degree. It showed large gains in key sectors, however, overall job growth remains narrowly concentrated and very limited. At the same time, federal government employment declined by 18,000, while areas in the financial space continued to exhibit weakness. These could be signs that parts of the economy are still under pressure.
What To Expect Moving Forward
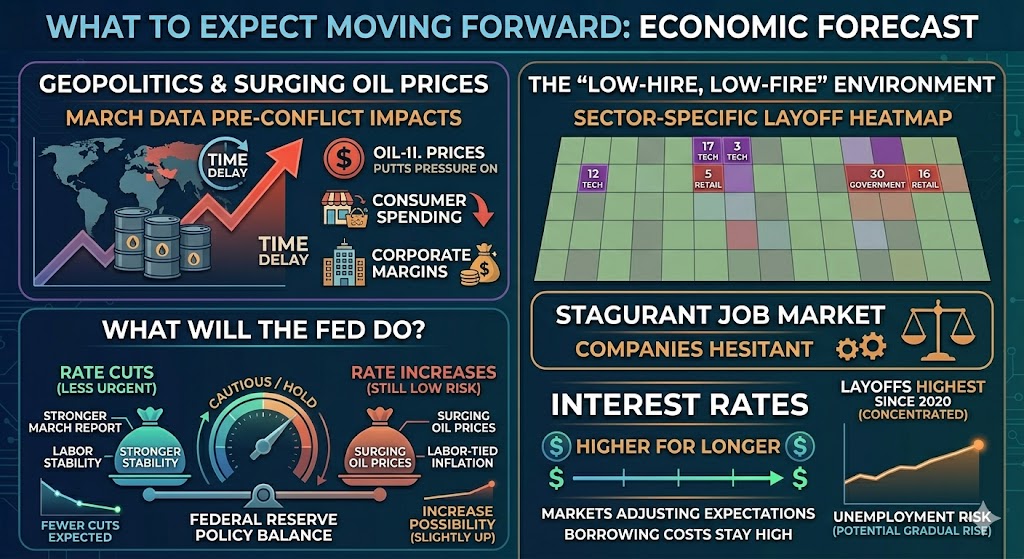
Geopolitics & Surging Oil Prices
Most of the March 2026 Jobs Report’s data was completed before the impacts of the Iran conflict — and rising oil prices that resulted — hit. That means the real effects will probably not show up until future jobs reports. As energy prices continue to climb, consumer spending could slow, particularly in sectors like retail, restaurants, and leisure. At the same time, higher costs may squeeze corporate margins and push real wages lower, creating additional economic drag.
The “Low-Hire, Low-Fire” Environment
The broader trend still points to a stagnant job market, with many companies hesitant to aggressively expand or cut employees. Although layoffs are at their highest levels since 2020, they’re concentrated in certain sectors — tech, government, retail — and aren’t widespread. The March 2026 Jobs Report shows the labor market seems to still be in slow-growth mode, with limited broad momentum. This points to the potential for modest payroll gains ahead, but also keeps the risk of a gradual rise in unemployment alive, especially if oil prices stay elevated.
What Will The Fed Do?
From a policy standpoint, the Federal Reserve is likely to remain cautious, since a stronger jobs report reduces the urgency for rate cuts. Right now, the labor market is in an awkward spot. It’s by no means booming, but considered strong enough, where rate cuts are no longer a given. Currently, I believe the Fed will likely keep rates where they are, with the possibility of increases still relatively low (but more likely than they were in previous months). The markets are now adjusting expectations for fewer rate cuts, which could keep borrowing costs higher for longer.
Implications For Traders

For traders, the March 2026 Jobs Report shows a more nuanced and complex picture. A stronger labor market could support equities…but also reduce the likelihood of near-term rate cuts. In environments like these, where markets are highly sensitive to Fed news, this could potentially put pressure on growth stocks. On the other hand, softer underlying trends and uneven job growth could keep the door open for future easing, while also increasing the chances of choppier, murkier market conditions.
This push and pull between strength and weakness is where sector rotation, volatility, and shifting interest rate expectations start to play a bigger role. Instead of a clear trend, I believe traders could likely see selective opportunities across different areas of the market.
Given the mixed signals from today’s jobs report, I believe traders should consider watching the following sectors:
- Energy
- Consumer Discretionary
- Financials
- Tech
Rising oil prices tied to geopolitical tensions could continue to support energy stocks. At the same time, they could also put pressure on consumer-facing sectors like retail and travel if spending tightens. I believe that financials are worth watching, as interest rate expectations shift and impact lending, margins, and overall sentiment. Meanwhile, tech and growth stocks could remain sensitive to Fed policy. If rate cuts get pushed further out, I think stocks that fall in those categories could face continued headwinds, despite broader market resilience.
Final Takeaways
The March 2026 Jobs Report delivered a headline surprise…but the real story lies beneath the surface. While job growth and declining unemployment offered a sense of relief, the broader trend still points to a slower, more fragile labor market. This is a classic case of “better than feared,” not a signal that the economy is back to full strength.
For traders, this distinction matters. Markets are caught in a crosshairs between conflicting forces: Resilient data that supports equities, and underlying weakness that keeps uncertainty — and volatility — alive. Throw in rising oil prices, geopolitical tension, and shifting Fed expectations, and you’re looking at an environment that’s anything but straightforward.
This isn’t a market for autopilot trading. It demands awareness, flexibility, and discipline. Sector rotation is likely to remain active, trends may be shorter-lived, and reactions to macro data could be more pronounced.
Right now, I think the real edge comes from adaptability — understanding the bigger picture, while being selective with execution. In markets like this, it’s not about predicting the next move perfectly…butt being prepared for multiple outcomes and reacting accordingly.

Economic Reports of Note (All Times EST):
Monday
10:00 am – US: ISM Non-Manufacturing PMI
11:30 am – US: 3 & 6-month Bill Auctions
Tuesday
8:15 am – US: ADP Employment
8:30 am – US: Durable Goods
8:55 am – US: Redbook
10:00 am – US: Atlanta Fed GDPNow
11:00 am – US: NY Fed 1-Year Consumer Inflation
12:35 pm – US: Fed Member Goolsbee Speaks
1:00 pm – US: 3-Year Note Auction
3:00 pm – US: Consumer Credit
10:00 pm – NZ: RBNZ Interest Rate Decision
Wednesday
5:00 am – EU: PPI & Retail Sales
7:00 am – US: Mortgage Data
10:30 am – US: Crude Oil Inventories
1:00 pm – US: 10-Year Note Auction
2:00 pm – US: FOMC Meeting Minutes
Thursday
8:30 am – US: PCE Price Index
8:30 am – US: GDP
8:30 am – US: Personal Spending & Income
8:30 am – US: Weekly Jobless Claims
10:00 am – US: Dallas Fed PCE
10:00 am – US: Wholesale Inventories
11:30 am – US: 4 & 8-week Bill Auctions
11:30 am – US: Atlanta Fed GDPNow
1:00 pm – US: 30-Year Bond Auctiion
Friday – Markets Closed in Observance of Good Friday
8:30 am – US: CPI
8:30 am – US: Real Earnings
10:00 am – US: Michigan Consumer Sentiment
10:00 am – US: Factory Orders
11:00 am – US: Cleveland CPI