Defining Volatility
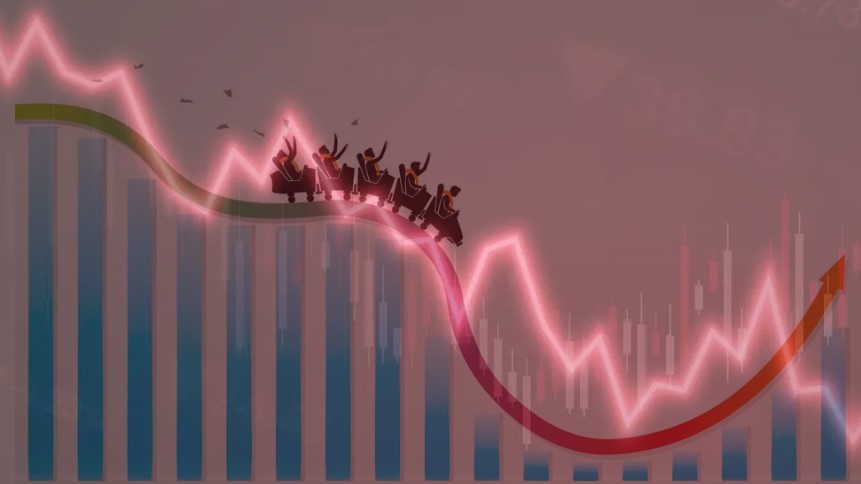
Volatility signifies a security or index price’s degree of variation over time, and is typically associated with price swings in either direction. Volatility often indicates how much risk or uncertainty is tied to the size of changes in an asset’s value.
Higher volatility means more risk (the asset’s price can change drastically over a short period of time in either direction). Lower volatility means an asset’s value shouldn’t fluctuate significantly, and will be more stable.
For example…
Stock ABC’s price is at $100. It rises to $120, drops to $70, and then goes back up to $90 in a span of three trading days.
Stock XYZ’s price is also at $100. It drops to $98, goes back to $100, and then falls to $99.50 over five trading days.
Stock ABC is the more volatile security of the two because its price endured steeper price fluctuations over shorter time periods. Stock XYZ is less volatile, since its price fluctuated to a much lesser degree.
Standard Deviation vs Variance
Volatility is generally measured by two metrics – standard deviation and variance.
In terms of market volatility, variance measures a stock’s susceptibility to veering from its median price. High variance means the asset is more likely to wildly fluctuate and is riskier. Low variance indicates less risk tied to the asset.
Standard deviation measures how far apart numbers are in a dataset. It helps find an asset price’s distribution from its median figure, but offers more clarity about how much it may move from the average cost. High standard deviation signifies wild price movement and a riskier investment. Low standard deviation means an asset’s prices are stabler and less riskier.
You essentially follow the same process to calculate both metrics, with an extra step to find the standard deviation.
Here’s a step-by-step example…
Stock ABC has the following closing prices over 10 consecutive trading days:

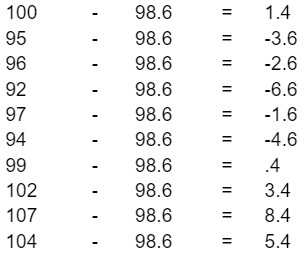
Step 1 – Calculate the mean
The dataset above has a median price of $98.60. We get this by adding up all 10 figures (986 total), and divide that number by 10 (total of individual numbers in the dataset).
Step 2 – Subtract each data point from the median value you determined in Step 1.
Subtract each individual number in the dataset from the mean.
Step 3 – Square each of the values you calculated in Step 2.
You square a number by multiplying it by itself.
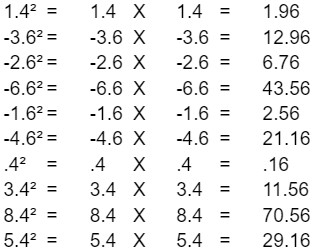
Step 4 – Add all the squared values you found in Step 3.
1.96 + 12.96 + 6.76 + 43.56 + 2.56 + 21.16 + .16 + 11.56 + 70.56 + 29.16 = 200.4
Step 5 – Divide the sum of your squared values by the dataset’s total of individual numbers subtracted by 1.
This is how you get your variance.
200.4 ÷ (10 – 1) = 200.4 ÷ 9 = 22.266
For the dataset above, 22.266 is your variance.
This shows us that when Stock ABC’s price fluctuates from its $98.60 average, it tends to stay within a range of $22.26. So in terms of the example above – within a range of $87.47-$109.73.
To find the standard deviation, you perform one more step.
Step 6 – Find the square root of your variance.
√22.266 = 4.71
The dataset above has a standard deviation of 4.71.
This calculation shows us that when Stock ABC’s price veers from its $98.60 average, it tends to by about $4.71. This indicates Stock ABC is a low-risk stock and not very volatile.
Historical vs Implied Volatility
Next, we’ll look at the two major types of market volatility – historical and implied. As their names indicate, historical volatility focuses more on past activity of an asset’s price. Implied volatility more so calculates future price movement. It’s also important to note that both historical and implied volatility are measured in percentages.
Historical Voaltility
Historical volatility measures an asset’s distribution of returns over a certain period of time. It shows the extent of which an asset’s price has veered from its average within a specified timeframe.
High historical volatility percentages mean the asset in question is riskier, and will move at higher-than-normal rates. Low percentages mean the exact opposite. Historical volatility usually gets measured incrementally (depending on an options trade’s intended duration), ranging anywhere from 10-180 days.
Historical volatility has a fairly straightforward calculation. All you do is multiply the standard deviation by the square root of the number of time periods. So, let’s say you’re trying to find a stock’s historical volatility over a period of 25 trading days. The stock’s standard deviation over that time is 15.50. All you do is multiply 15.50 by the square root of 25 (which is 5), which comes out to 77.5%.
Here’s another example…
Let’s say Stock XYZ has 25% historical volatility over a 21-trading day period. Relatively speaking, this is considered low for historical volatility (anything under 30-35% is low, while anything above 65-70% is largely viewed as high).
In this hypothetical scenario, we’ll say Stock XYZ has a historical volatility of 49% during those final five trading days of the 21-day period we’re analyzing. That means Stock XYZ is trading with higher-than-normal volatility over those last five days within the 21-day timeframe.
Implied Volatility
This metric forecasts the extent that an asset can deviate from its median price over a one-year timeframe, based on its historical volatility. High implied volatility indicates the market expects an asset to move from its median price by a considerable amount over the next year. Low implied volatility means the market expects an asset to stay at or near its median price within a 12-month timeframe. Like historical, implied volatility doesn’t predict what direction an asset’s price will move, and only projects the likely level of movement.
Implied volatility gives traders an idea of how volatile they can expect the market to be moving forward, making it a good way of calculating probability. You find an asset’s implied volatility using its options prices. However, since it’s implied, traders can’t use past price performance as an indicator like with historical volatility. Anything under 20% is considered low implied volatility, and above 80% is viewed as high.
So, let’s say Stock XYZ is currently trading at $100 per share. The market expects Stock XYZ’s price to rise, and it has an implied volatility of 25%. That means most of the market expects Stock XYZ’s price to stay between $75-$125 over the next year. The minority either believe Stock XYZ’s price will fall below $75 or go over $125.
Enjoying our content?
Sign up for our free newsletter – Traders Daily Brief
Read more of our blogs