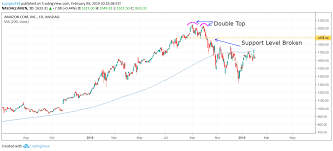
A double top is an extremely bearish technical reversal pattern that forms after an asset reaches a high price two consecutive times with a moderate decline between the two highs. It is confirmed once the asset’s price falls below a support level equal to the low between the two prior highs.

There is indeed a significant difference between a double top and one that has failed. A real double top is an extremely bearish technical pattern which can lead to an extremely sharp decline in a stock or asset. However, it is essential to be patient and identify the critical support level to confirm a double top’s identity. Basing a double top solely on the formation of two consecutive peaks could lead to a false reading and cause an early exit from a position.


