April 14, 2020

What Is A “Head and Shoulders” Pattern In Technical Analysis?

The head and shoulders pattern forms when a stock’s price rises to a peak and subsequently declines back to the base of the prior up-move. Then, the price rises above the former peak to form the “nose” and then again declines back to the original base. Then, finally, the stock price rises again, but to the level of the first, initial peak of the formation before declining back down to the base or neckline of chart patterns one more time.

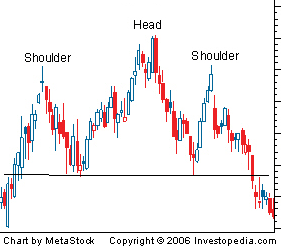
  1. After long bullish trends, the price rises to a peak and subsequently declines to form a trough.
  2. The price rises again to form a second high substantially above the initial peak and declines again.
  3. The price rises a third time, but only to the level of the first peak, before declining once more.

about the author:

Mike Shorr

Since 1994, Michael has been an on-the-floor market maker, Vice-President of Interest Rate Derivatives for Knight Financial Products and Director of Education and Options Instructor at Trading Advantage. He makes the oftentimes complex world of options and trading accessible to the novice and advanced trader alike. Michael has a Bachelor of Science degree in Statistics and Finance from the University of Illinois Champaign-Urbana. He presently is Director, Trader Education at ProsperTradingAcademy.

Read Similar Articles

January 4, 2024

Funder Trading Review – Best Prop Trading Firm in 2024?

If you are actively trading in the stock market in 2024, chances are you’ve heard a new buzzword flying around: Prop Trading, short for Proprietary Trading. Whether you’ve tried prop trading or not – or have even heard of it at all – its popularity is quickly growing because it provides everyday traders with a […]

Read Article
September 26, 2022

Coach’s Roundtable: FOMC Fallout & Resilient Market Sectors

Every week, the coaches at Prosper Trading Academy offer their insight on some of the most challenging questions covering recent stock market developments, trading tips, and relevant news stories. This week, Scott Bauer, Charlie Moon, and Mike Shorr give their thoughts on why certain stock market sectors are staying resilient amid the FOMC fallout, and […]

Read Article
volatility
September 20, 2022

What Does Volatility Mean?

Defining Volatility Volatility signifies a security or index price’s degree of variation over time, and is typically associated with price swings in either direction. Volatility often indicates how much risk or uncertainty is tied to the size of changes in an asset’s value. Higher volatility means more risk (the asset’s price can change drastically over […]

Read Article