Volatility skew refers to the fact that options on the same underlying asset, like a stock or a future, with different strike prices, but which expire at the same time, have different implied volatilities. Implied volatility can be explained as the uncertainty related to an option’s underlying stock, and the changes triggered in different options’ trading prices.
Puts on a typical equity or ETF skew curve will have higher volatilities than calls. This is intuitive because of the way that prices tend to move in this type of market. When equities go up, they tend to go up in a slow, measured fashion. When they go down, it tends to do so violently. There is more fear of the downside because the natural position of a market participant is long the underlying asset.
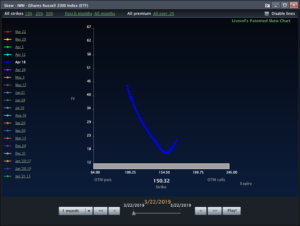
Below you will see a skew graph of the Russell 2000 Index ETF, IWM.
Follow me on Twitter @MikeShorrCbot


