June 17, 2019

Why Do We Use Standard Deviation?

The standard deviation formula is very simple: it is the square root of the variance. It is the most commonly used measure of spread.

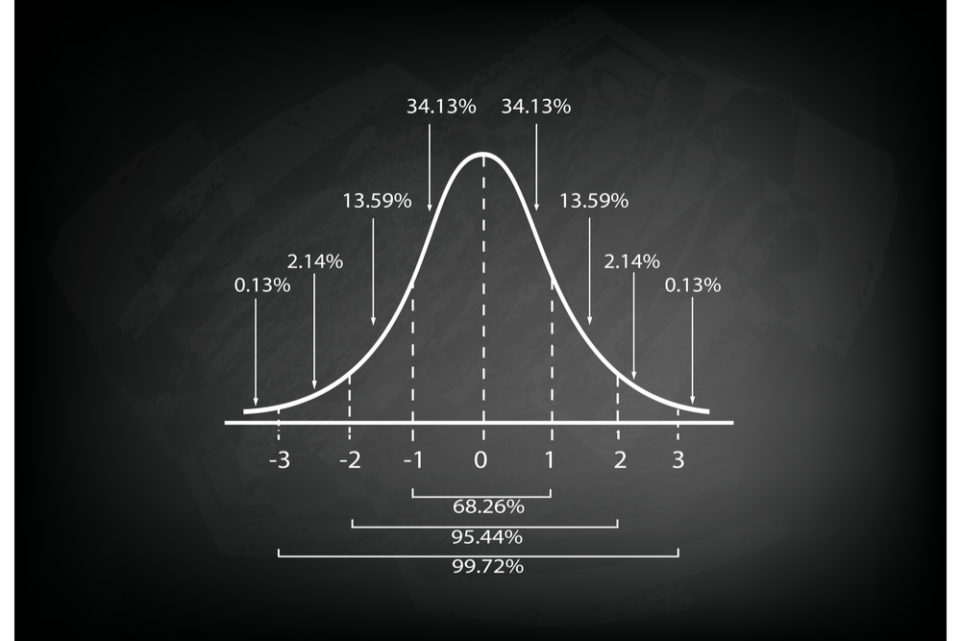
An important attribute of the standard deviation as a measure of spread is that if the mean and standard deviation of a normal distribution are known, it is possible to compute the percentile rank associated with any given score. In a normal distribution, about 68% of the scores are within one standard deviation of the mean and about 95% of the scores are within two standard deviations of the mean.

The standard deviation has proven to be an extremely useful measure of spread in part because it is mathematically tractable. Many formulas in inferential statistics use the standard deviation.

Follow me on Twitter @MikeShorrCbot

about the author:

Mike Shorr

Since 1994, Michael has been an on-the-floor market maker, Vice-President of Interest Rate Derivatives for Knight Financial Products and Director of Education and Options Instructor at Trading Advantage. He makes the oftentimes complex world of options and trading accessible to the novice and advanced trader alike. Michael has a Bachelor of Science degree in Statistics and Finance from the University of Illinois Champaign-Urbana. He presently is Director, Trader Education at ProsperTradingAcademy.

Read Similar Articles

September 26, 2022

Coach’s Roundtable: FOMC Fallout & Resilient Market Sectors

Every week, the coaches at Prosper Trading Academy offer their insight on some of the most challenging questions covering recent stock market developments, trading tips, and relevant news stories. This week, Scott Bauer, Charlie Moon, and Mike Shorr give their thoughts on why certain stock market sectors are staying resilient amid the FOMC fallout, and […]

Read Article
volatility
September 20, 2022

What Does Volatility Mean?

Defining Volatility Volatility signifies a security or index price’s degree of variation over time, and is typically associated with price swings in either direction. Volatility often indicates how much risk or uncertainty is tied to the size of changes in an asset’s value. Higher volatility means more risk (the asset’s price can change drastically over […]

Read Article
September 16, 2022

Coach’s Roundtable: Making Up Major Losses

Every week, the coaches at Prosper Trading Academy offer their insight on some of the most challenging questions covering recent stock market developments, trading tips, and relevant news stories. This week, Scott Bauer, Charlie Moon, and Mike Shorr cover this week’s CPI report and other future events that could impact the market, along with ways […]

Read Article

Read Similar Articles

September 26, 2022

Coach’s Roundtable: FOMC Fallout & Resilient Market Sectors

Every week, the coaches at Prosper Trading Academy offer their insight on some of the most challenging questions covering recent stock market developments, trading tips, and relevant news stories. This week, Scott Bauer, Charlie Moon, and Mike Shorr give their thoughts on why certain stock market sectors are staying resilient amid the FOMC fallout, and […]

Read Article
September 16, 2022

Coach’s Roundtable: Making Up Major Losses

Every week, the coaches at Prosper Trading Academy offer their insight on some of the most challenging questions covering recent stock market developments, trading tips, and relevant news stories. This week, Scott Bauer, Charlie Moon, and Mike Shorr cover this week’s CPI report and other future events that could impact the market, along with ways […]

Read Article
August 26, 2022

Coach’s Roundtable: Stock Market Indexes & Trading Fixes

Every week, the coaches at Prosper Trading Academy offer their insight on some of the most challenging questions covering recent stock market developments, trading tips, and relevant news stories. This week, Scott Bauer, Charlie Moon, and Mike Shorr touch on the best stock market indexes to follow and common issues they notice among struggling traders. […]

Read Article