
Major indices changed course in a meaningful way this past week, ending in the green despite significant initial volatility.
For the week, the S&P 500, Dow and Nasdaq-100 all gained just under 1%. Headline whiplash about developments in the war between the U.S. and Iran ended with hope that an agreement is in the offing. The price for U.S. benchmark crude oil sank roughly 7% on the week to two-month lows near $84 per barrel.
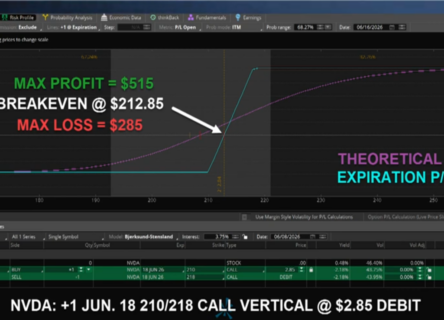
The SpaceX (SPCX) initial public offering Friday, with a $135 offering price, $150 opening trade and $160.95 close, will go down as the largest IPO ever and is a strong indication of market optimism about new growth frontiers. The week also showed there is no stopping the artificial intelligence growth narrative. The Philadelphia Semiconductor Index (SOX) spiked more than 9% over the last five trading days.
Inflation will be a theme this holiday shortened week, with geopolitical tension and oil price trends defining conversations as the Federal Reserve Open Market Committee meets Tuesday and Wednesday.
For the week, the Dow gained +0.7% to 51,202, the S&P 500 also added +0.7% to 7,431, and the Nasdaq hit the trifecta rising by +0.7% to 25,889 The Russell 2000 soared by +3.9% to 2,944. The CBOE Volatility Index declined by -17.8% to 17.68.
Inflation Surged to 4.2% Highest Since 2023

Price pressures intensified further in May as the Strait of Hormuz energy shock continued to feed through the Consumer Price Index basket, reinforcing the case for Federal Reserve’s interest rate hike in 2026.
The headline inflation rate climbed from 3.8% year-over-year in April to 4.2% in May, matching economist expectations. That is the hottest reading since April 2023 and pushing the measure further away from the Fed’s 2% target. On a monthly basis, prices rose 0.5%, matching the 0.5% consensus after April’s 0.6% print.
Stripping out food and energy, core inflation rose from 2.8% to 2.9%, also matching forecasts. Underlying month-over-month pressures rose 0.2%, decelerating from the prior 0.4% against a 0.3% consensus.
The May print follows April’s 3.8% reading and 6.0% surge in producer prices, marking the third consecutive uncomfortable inflation print for the Federal Reserve under new Chair Kevin Warsh.
But where did it hit the hardest?

Which leads right into the next worry for the economy…
The LETTER “K”. As in “K” Shaped Economy!
K is For?

Higher-income households are weathering higher inflation better than middle- and lower-income Americans, underscoring the prevalence of the so-called K-shaped economy, according to the Federal Reserve’s Beige Book. The Beige Book is a compilation of anecdotal reports on economic conditions in the Fed’s 12 districts. Information is gathered through interviews with local business owners, economists, and others.
The “K-shaped” economy is the latest expression of wealth inequality. The U.S. economy is experiencing a growing gap between the highest earners and the richest corporations, who are spending and expanding their wealth, and the lowest-income households and mom-and-pop companies, who struggle to pay their bills day to day.
“Higher-income households remained resilient and less sensitive to price increase, while middle-income households were described as ‘squeezing more life out of every dollar before deciding to spend it,’ and low-income consumers showed greater financial strain,” the report read.

The K-shaped economy is characterized by robust growth, expanding wealth, and a vibrant economy in the arms at the top of the K. The legs of the K are where lower-income earners and small businesses continue to struggle. The top 10% of households by income account for about half of all the spending in the U.S. economy.

While the Fed is widely expected to hold rates steady when it gives its monetary policy statement on Wednesday, investors will look for signs of policymakers’ views going forward.
New Fed Chair Kevin Warsh was picked by President Donald Trump, who railed at the central bank and prior Fed Chair Jerome Powell for not cutting rates more to his liking. But as mentioned above, Fed fund futures suggest market expectations that the central bank will increase rates by the end of the year.
Economic data this week showed U.S. consumer inflation in May increased at its fastest pace in three years. The inflation reports, along with recent solid employment data, have led investors to think the Fed will focus on containing inflation, which could mean leaning more toward rate hikes.
As part of the meeting, Fed officials are expected to give projections about the path of interest rates and about the economy, including inflation. Investors will also scrutinize Warsh’s press conference after the policy decision on Wednesday. Investors will also want to learn Warsh’s policy goals and how he might seek to reshape the Fed.
For example, Warsh has expressed a desire to pare the Fed’s $6.7 trillion balance sheet, which could cause ripples in markets.
Warsh might also seek to change the way the Fed communicates or gives guidance about policy, investors said.

Economic Reports of Note (All Times EST):
Monday
8:30 am – US: NY Empire State Manufacturing Index
9:15 am – US: Industrial & Manufacturing Production
9:15 am – US: Capacity Utilization
10:00 am – US: NAHB Housing Market Index
11:30 am – US: 3 & 6-month Bill Auctions11:30 pm – AUS: RBA Interest Rate Decision
Tuesday
8:15 am – US: ADP Employment Change Weekly
8:30 am – US: Import/Export Price Index
8:30 am – US: Housing Starts & Building Permits
8:55 am – US: Redbook
10:00 am – US: Atlanta Fed GDPNow
1:00 pm – US: 20-year Bond Auction
Wednesday
2:00 am – UK: CPI & PPI
5:00 am – EU: CPI
7:00 am – US: Mortgage Data
8:30 am – US: Retail Sales10:00 am – US: Pending Home Sales10:00 am – US: Business Inventories
10:30 am – US: Crude Oil Inventories
11:30 am – US: Atlanta Fed GDPNow
1:00 pm – US: Fed Interest Rate Decision
1:30 pm – US: FOMC Press Conference
Thursday
8:30 am – US: Philadelphia Fed Manufacturing Index
8:30 am – US: Weekly Jobless Claims
11:30 am – US: 4 & 8-week Bill Auctions
Friday
US Markets Closed for Juneteenth