
When Bad is Bad

Wall Street’s three main indexes closed down on Friday amid a sudden setback in the U.S. labor market and a 12% spike in U.S. oil prices due to the escalating conflict in the Middle East. Oil prices rose more than 36% this week.
Sometimes “bad” economic data can be “good” for the market and vice versa. However, the latest jobs report was just plain “BAD.” A disappointing nonfarm payrolls report intensified worries that the U.S. economy could be cooling just as geopolitical tensions in the Middle East push energy costs sharply higher.
That mix threatens to handcuff the Federal Reserve, complicating its path to rate cuts and reviving concerns about renewed inflation pressure. The increase in oil prices fueled expectations of higher input costs and pressure on corporate profits, adding to the likelihood of weaker credit conditions, which is typically negative for lenders.
Further, U.S. Treasury yields rose significantly this week as the ISM Manufacturing Prices guage jumped more than expected in February, further exacerbating inflation concerns. The 10-year bond yield, which traded down to 3.97% last week, surged as high as 4.15% and closed Friday near 4.13%.
For the week, the Dow lost -3% to 47,502, the S&P 500 closed lower by -2% to 6,740, the Nasdaq gave back -1.2% to 22,388 and the Russell 2000 declined by -4.1% to 2,525. The CBOE Volatility Index gained +48.5% to 29.49, its highest close since April 2022.
Where Did All the Jobs Go?
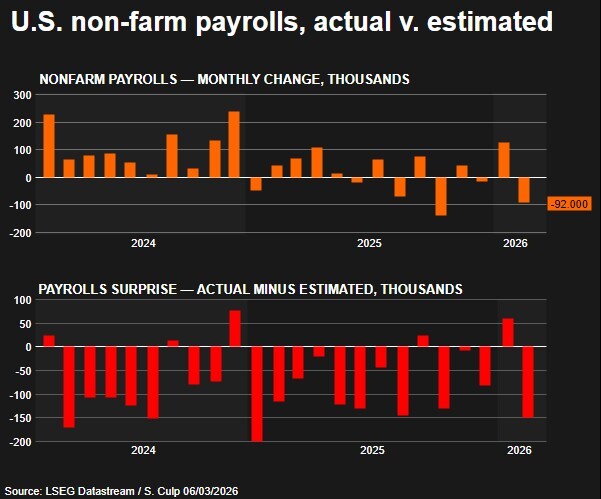
It’s a rare day when a jobs number is not the key news item but the conlict in Iran has taken center stage. However the numbers just flat out stunk. It’s nearly impossible to sugarcoat.
Nonfarm Payrolls showed a loss of 92,000 jobs — far, far below the +55K consensus estimate. January was revised down by a mere 4K to +126K, but the two-month revision was another -69K. Combining February’s 147K shortfall with the -69K revision, we end up with 216,000 fewer Nonfarm Payrolls on the books than we thought after the December report. That’s not a huge number when compared to a total labor force of about 170 million, but relatively small changes can yield relatively large adjustments in policy.
Furthermore, the Unemployment Rate rose to 4.4%, above last month’s 4.3%, which was also the consensus estimate. This occurred even as the Labor Force Participation Rate fell to 62% from 62.5%. Considering that the latter number acts as the denominator of the Unemployment Rate, it implies that the number of job seekers rose faster.
Average Hourly Earnings rose by 0.4% on a monthly basis, matching last month’s rise and above the 0.3% consensus. That’s good news for those who received raises or worked more hours, but not a welcome sign for those who are concerned about stagflation.

This was an historic week for the energy markets. WTI crude crossed above $90 for the first time since September 2023, diesel prices surged more than 39% in a single week, and the national average price for gasoline at the pump rose 11.3%, according to AAA.
The initial catalyst for the rally was the shock of tankers being struck near the Strait of Hormuz, which brought traffic through the waterway virtually to a halt. Roughly 20 million barrels per day of oil flows typically pass through the strait, and a significant portion of those shipments are now unable to reach their final destinations.
However, the conflict has now entered a new phase. Instead of focusing solely on maritime disruption, key oil refining and LNG infrastructure has become a target of attacks by the Iranian regime, forcing some facilities to slow production or halt operations altogether. This development could ultimately have a more significant impact on energy markets than the disruption to vessel traffic alone.
This situation will be important to monitor in the coming week. The more refining and extraction operations that are shut, the more difficult it becomes to restore production. In many cases, it can take three to four weeks for these facilities to return to their pre-conflict production capacity.

The VIX on Friday closed at its highest level since April 2022. In fact the index remains in a state of “backwardation” or “inversion,” which is historically a signal of a potential stock-market bottom.
Whenever markets encounter turbulence, investors turn their attention to the VIX. The fear gauge, which was launched in 1990 by Cboe Global Markets, uses trading in the options market tied to the S&P 500 to impute how volatile investors expect the index will be over the coming month or so.
The VIX is widely seen as a counterindicator: The higher it climbs, the higher the likelihood that any selloff in stocks is nearing its end. Readings above 30 are pretty rare; since Jan. 1, 1990, the VIX has finished above 30 on less than 1% of trading days. It has finished above 80 on only three occasions — just 0.03% of the time, according to Dow Jones Market Data.
When looking for a sweet spot to buy back into stocks, Nicholas Colas, co-founder of DataTrek, told MarketWatch that seeing the VIX close at 27.5 or above is as a solid rule of thumb. In the past, when the VIX has finished above that level, stocks were higher one year later more than 70% of the time, Colas told MarketWatch.
He believes a close above 27.5 is an important indicator, even if previous short-lived ructions in October and November saw the VIX only briefly cross above this threshold intraday.

Economic Reports of Note (All Times EST):
Monday
11:00 am – US: NY Fed 1-Year Consumer Inflation Expectations
11:30 am – US: 3 & 6-month Bill Auctions
7:50 pm – JAP: GDP
Tuesday
6:00 am – US: NFIB Small Business Optimism
8:15 am – US: ADP Weekly Employment Change
8:55 am – US: Redbook
10:00 am – US: Existing Home Sales
1:00 pm – US: 3-year Note Auction
Wednesday
7:00 am – US: Mortgage Data
8:30 am – US: CPI
8:30 am – US: Real Earnings
8:30 am – US: FOMC Member Bowman Speaks
10:30 am – US: Crude Oil Inventories
11:00 am – US: Cleveland CPI
1:00 pm – US: 10-year Note Auction
Thursday
8:30 am – US: Weekly Jobless Claims
8:30 am – US: Trade Balance
8:30 am – US: Housing Starts & Building Permits
11:30 am – US: 4 & 8-week Bill Auctions
1:00 pm – US: Atlanta Fed GDPNow
1:00 pm – US: 30-year Bond Auction
Friday
3:00 am – GBP: GDP
8:30 am – US: GDP
8:30 am – US: PCE Price Index
8:30 am – US: Durable Goods
8:30 am – US: Personal Spending & Income
10:00 am – US: JOLTS
10:00 am – US: Michigan Consumer Sentiment
10:00 am – US: Dallas Fed PCE
11:30 am – US: Atlanta Fed GDPNow