
Many successful stock traders will agree that moving averages (MA) are one of the most important indicators available. The fundamentals behind moving averages are pretty straightforward, and very important to understand before applying them in your trading. Knowing how this tool works and what it’s capable of telling you about the securities you’re monitoring can give stock traders a significant edge in technical analysis.
What Are Moving Averages?
In layman’s terms, moving averages are stock trading indicators that determine a security’s median price over a specific timeframe. They typically help calculate what direction a stock is trending, support and resistance levels, and can mitigate the impacts of random short-term price fluctuations. A stock’s moving average rarely (if at all) emulates their current price down to the penny. Since MAs are based on past pricing, they will lag behind a stock’s current price to some extent. Longer time periods result in greater lags and vice versa.
MA data clarifies important factors like market and stock sentiment, buying and selling opportunities, along with support and resistance levels. Rising MAs indicate an uptrend and vice versa. Upward momentum is signified by what’s called a bullish crossover. This is when a short-term MA crosses above a longer-term moving average.
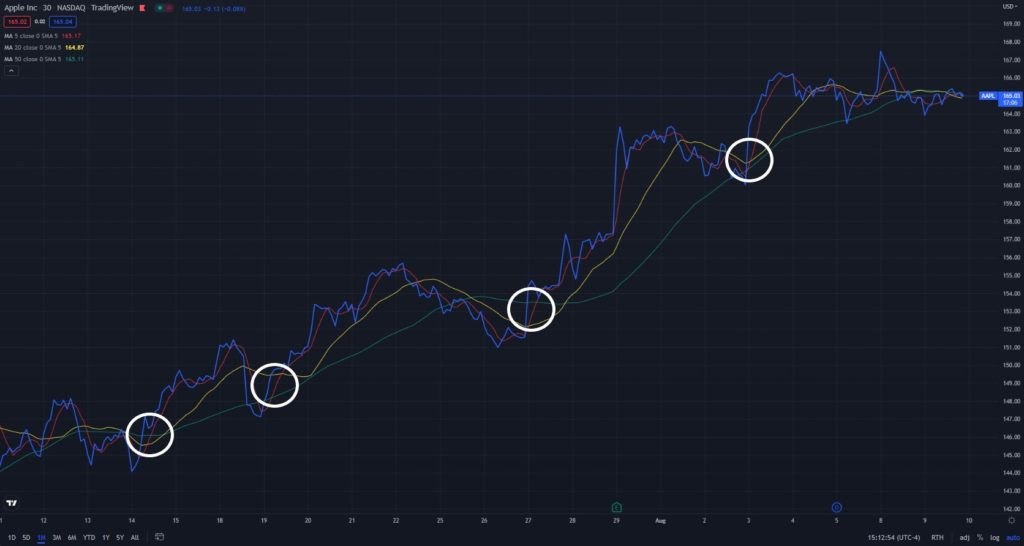
The example below shows a one-month chart for Apple (AAPL). The red, yellow, and green lines respectively represent the five, 20, and 50-day moving averages. The four circled areas mark spots where the shorter-term MA (five-day) crosses above the longer-term ones (20, 50-day). As you can see, each of these instances was followed by a price jump.
Downward momentum on the other hand, is clarified with a bearish crossover, which happens when a short-term MA crosses below a long-term one.
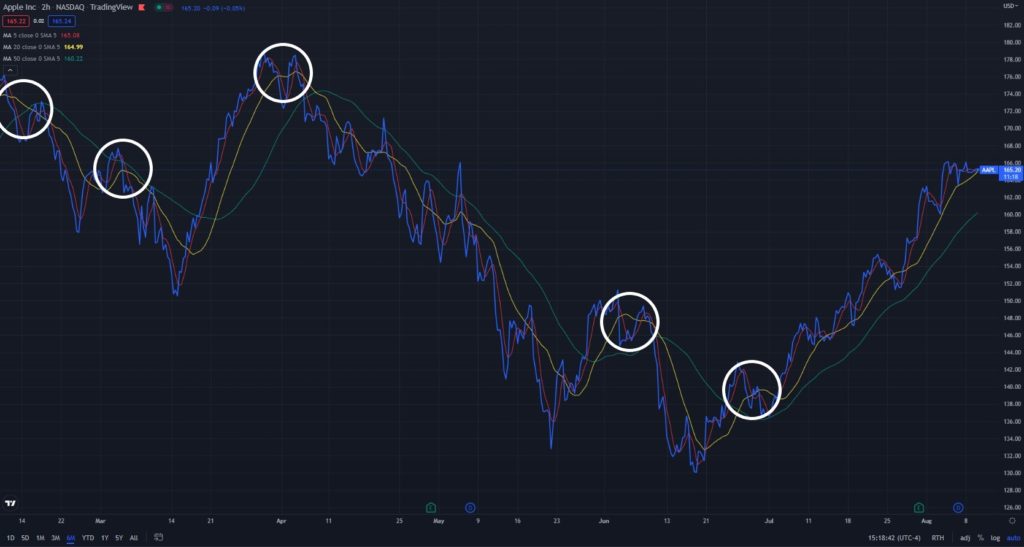
Sticking with AAPL in the example below, its six-month chart contains five prominent examples of a bearish crossover. Whenever the five-day MA dipped below the 20 and/or 50-day MAs, this movement subsequently led to a drop in Apple’s stock price.
How to Calculate Moving Averages
Calculating a moving average is fairly straightforward. All you do is divide the sum of a stock’s closing price over a specific time period by the number of days.
For example, to calculate a stock’s 50-day moving average, you add the security’s closing price for each of the last 50 trading days, and divide that number by 50.
Simple Moving Average
There are two main types of moving averages – simple (SMA) and exponential (EMA). Stock traders calculate SMAs by taking the sum of a stock’s price over an x number of days, and divide it by the length of that timeframe (as explained above). SMAs are effective in identifying reversals and trends, measuring the strength of a stock’s momentum, along with determining potential resistance or support levels.
While EMAs add extra weight to a stock’s recent prices, SMAs sum up these figures equally. This makes it an efficient tool for long-term trading. SMAs smooth out recent price volatility, and take a wider view of these trends to help stock traders project future potential trade opportunities. When a stock price crosses its SMA, it often triggers a trading signal. Prices crossing above the SMA means a stock trader might want to go long or cover short. Crossing below the SMA means they might want to go short or exit long.
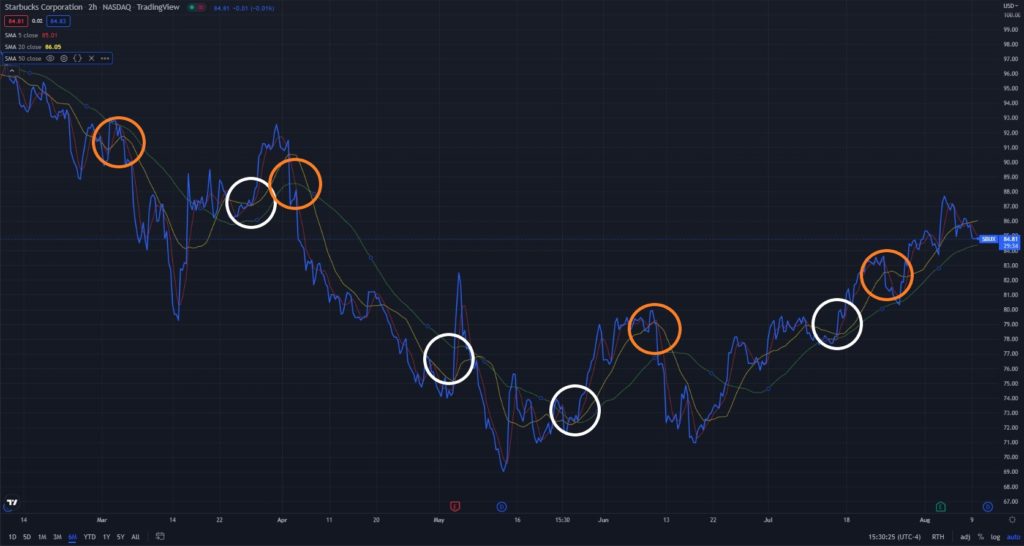
The six-month chart for Starbucks (SBUX) shows good examples of both these occurrences. The red, yellow, and green lines respectively represent the five, 20, and 50-day SMAs. The white circles show where the stock price crosses above these moving averages – resulting in a subsequent price increase. The orange circles show instances where the stock prices crosses below the SMAs, leading to a price drop.
Exponential Moving Average
As its name suggests, an EMA follows price movement more closely. They incorporate this specific variable by giving more weight to recent prices. This is the key difference between simple and exponential moving averages. As a result, EMAs have shorter delays and turn faster than SMAs covering the same time period. An EMAs higher sensitivity to price movement makes them very useful in short-term trading analysis. They can identify potential trends earlier than SMAs, but are more prone to short-term changes. A 200-day EMA, for example, will react quicker to the most recent price changes than a 200-day SMA, due to its shorter lag time.
EMAs are commonly used as a confirmation measure, and seldom function independently. That’s why many stock traders use them alongside other indicators to validate major market moves. EMAs are also useful in determining a stock’s trend direction. A rising EMA usually signals a potential buying opportunity if the stock’s price dips near or below the moving average. A falling EMA typically prompts traders to sell if a stock price moves towards or just above the moving average. The same principles also apply when using EMAs to identify potential support and resistance levels.
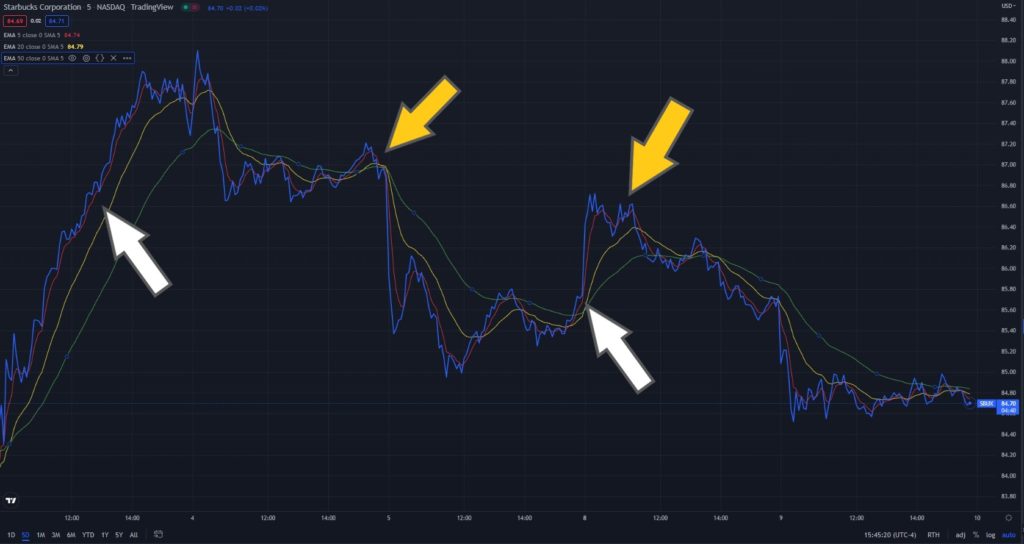
The example below shows both of these instances on the five-day chart for Starbucks. The white arrows point to areas where the stock price dipped near or below the rising EMA, while the orange arrows identify instances where the stock price moved toward or just above the EMA when its value was declining. As explained above, the stock price respectively increased and decreased accordingly.
Enjoying our content?
Sign up for our free newsletter – Traders Daily Brief
Read more of our blogs