Day trading options requires precision, discipline, and the ability to recognize high-probability setups quickly. While there are countless patterns traders attempt to capitalize on, some consistently offer better risk-reward profiles than others.
At Prosper Trading Academy, we’ve trained hundreds of traders to identify and execute these patterns with confidence. Today, we’re sharing three of the most reliable patterns for daytrading options.
1. The Opening Range Breakout
The Opening Range Breakout (ORB) is one of the most popular patterns among professional options day traders, and for good reason. This pattern capitalizes on the volatility and momentum that often occurs in the first 15-30 minutes of the trading session.

How It Works: The opening range is established by identifying the high and low of the first 15 or 30 minutes after the market opens. When price breaks decisively above the high or below the low of this range with increased volume, it often signals the beginning of a directional move.
Why It’s Effective for Options: The expanded volatility during the opening period increases option premiums, but once a clear direction is established, the momentum can lead to rapid gains. Call options benefit from upside breaks, while put options profit from downside breaks.
Key Considerations: Not every breakout is genuine. We teach our traders to look for confirmation through volume spikes and strong momentum candles. Additionally, be aware of the “false breakout” where price briefly exceeds the range only to reverse. Using a disciplined approach with predetermined stop-losses is essential.
Risk Management: Never risk more than 1-2% of your trading capital on a single ORB setup. The pattern works best on liquid stocks with options that have tight bid-ask spreads.
2. The Bull Flag and Bear Flag Continuation
Continuation patterns are the bread and butter of successful day trading because they allow you to enter trades in the direction of the prevailing trend with reduced risk. The bull flag and bear flag patterns are among the most reliable.
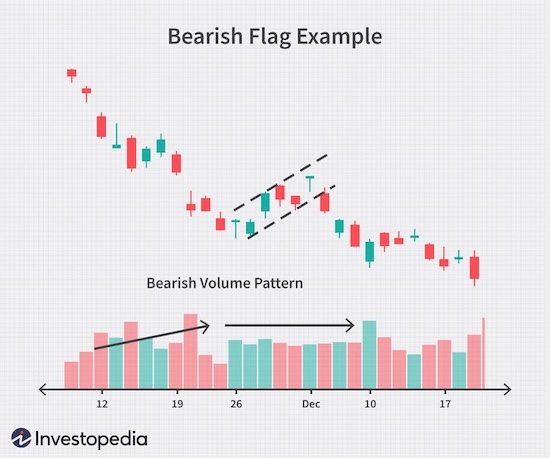
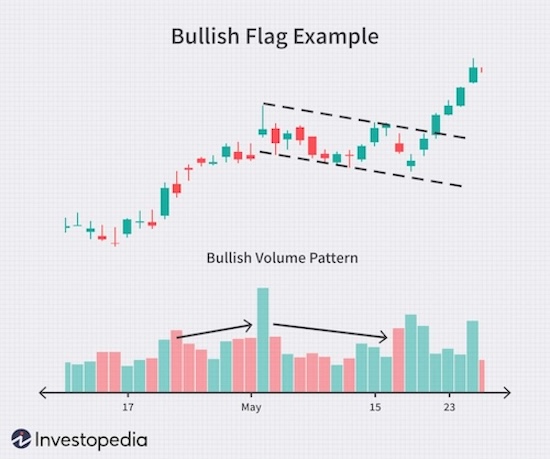
How It Works: After a strong directional move (the “flagpole”), price consolidates in a tight range that slopes gently against the trend. For a bull flag, this means a slight downward consolidation after an upward move. For a bear flag, it’s a slight upward consolidation after a downward move. The breakout from this consolidation typically continues in the direction of the original trend.
Why It’s Effective for Options: These patterns offer excellent risk-reward ratios because you can enter near the consolidation with a tight stop-loss, while the profit target is often equal to or greater than the length of the flagpole. Options amplify these moves, turning a 2-3% stock move into potentially 20-50% or more in option value.
Key Considerations: The consolidation should ideally last between 5-20 candles on your trading timeframe. Flags that consolidate too long often fail as the momentum dissipates. Volume should contract during the consolidation and expand on the breakout.
Execution Tips: We recommend waiting for a decisive break of the flag’s trendline with a strong candle close beyond the boundary. Consider using at-the-money or slightly in-the-money options to balance leverage with probability of success.
3. The VWAP Bounce
The Volume Weighted Average Price (VWAP) acts as a dynamic support and resistance level that professional traders and institutions closely monitor. When used correctly, VWAP bounces can provide low-risk, high-probability entries.
How It Works: Throughout the trading day, VWAP represents the average price at which a stock has traded, weighted by volume. When price pulls back to VWAP in an uptrend, it often finds support and bounces. Conversely, in a downtrend, VWAP acts as resistance where price may reject and continue lower.
Why It’s Effective for Options: VWAP bounces offer clear entry and exit points. The proximity to VWAP allows for tight stop-losses (just beyond VWAP), while the potential for a return to the day’s high or low offers substantial upside. This risk-reward profile is ideal for options trading.
Key Considerations: VWAP bounces work best when the overall trend is clear. In a choppy, sideways market, price may cross VWAP repeatedly without establishing a clear direction. Look for the first or second touch of VWAP rather than the fifth or sixth, as the level’s significance diminishes with repeated tests.
Advanced Application: Combine VWAP with other technical indicators like RSI or price action signals. For example, a bullish candlestick pattern forming right at VWAP support adds confirmation to your trade thesis.
Putting It All Together
While these three patterns form the foundation of a solid options day trading strategy, remember that no pattern works 100% of the time. Success comes from proper risk management, disciplined execution, and continuous education.
At Prosper Trading Academy, we don’t just teach patterns—we teach traders how to think strategically, manage risk effectively, and develop the psychological discipline required for consistent profitability. Each of these patterns becomes more powerful with the right mindset and a tactical approach.
If you’re interested in taking your training to the next level, sign up for a 1-on-1 strategy session with our team. They can help you find the best Prosper program for you and your trading goals.