What is Prop Trading?
Prop trading has exploded in popularity over the last five years. It’s transformed from a niche practice into a mainstream gateway for retail traders. There’s a lot of highly skilled traders out there who are sitting on the sidelines right now for two main reasons:
- They’re unwilling or unable to risk their own money in the market
- They lack the capital to make meaningful trades
Prop trading addresses both issues.
In a nutshell, prop trading (aka proprietary trading) gives qualified traders a chance to trade stocks, options, and other assets with outside funding. In most cases, you first have to qualify for a program by completing a trading challenge.

It typically requires you to meet certain criteria within a specific timeframe:
- Hitting (and sustaining) certain profit thresholds
- Making a minimum number of trades
- Showing consistent profitability
- Keeping your total losses below a certain amount
If you complete the challenge successfully, you’ll get access to a funded trading account.
Every prop trading firm has different rules, tiers, and limits for funding, daily (and total) losses, fees, and profit sharing (between the prop trader and firm).
My firm, Funder Trading, is no exception.
However, there’s something that I believe makes Funder stand out from other prop trading firms…
I make sure my traders are equipped with the training, tools, and strategies to potentially succeed.
To give you an idea of what that entails, I’m going to break down how my #1 prop trading strategy works, something I call the Premarket Pulse Pattern.
Premarket & Prop Trading: The Anticipated Edge
Premarket trading plays a crucial role in my Premarket Pulse Pattern strategy that I believe can give prop traders a uniquely powerful edge.

Although official trading hours are from 9:30 AM – 4:00 PM ET in the US, you can still trade certain assets before the market opens. In the US, premarket trading starts at 4:00 AM ET. “Normal” premarket hours occur from 8:00 AM – 9:30 AM ET. It’s usually dominated by institutional investors and market makers. However, it has become increasingly accessible for retail traders.
Watching and analyzing premarket trading can give prop traders a critical informational and planning edge for three main reasons:
You can find out where big money is going, uncover heightened market activity, and which stocks look poised for big moves.
Institutional Money Flow: Like I mentioned earlier, the premarket is a great time to figure out where institutional investors are putting their money. This is important because institutional investors account for 80-90% of daily market activity. By learning where the big money is going, it can help lay out your prop trading gameplan before the trading day even starts.
Heightened Market Activity: More often than not, premarket trading can help you anticipate where the big market moves could happen during regular trading hours. Since institutional trading activity is particularly high during this time, certain trends tend to emerge, usually in major stocks, sectors, or indices. It can help you figure out which types of stocks are likely to move after the open.
Stocks Poised For Big Moves: To bring things full circle, everything I just covered all boils down to one thing: Finding out which stocks are positioned for big moves. Some of the biggest signs are price swings and directional movement. It’s a great way to narrow down which stocks to keep on your radar during regular trading hours.
Premarket Profit Pattern: The Prop Trading Strategy
Now that I explained the role of premarket trading in my Premarket Pulse Pattern, I’m going to break down the steps I follow. Each one helps me identify which stocks to put on my radar, and what they must do before I consider entering a trade.
Finding Stocks Primed For Big Moves
The first step in my Premarket Pulse Pattern strategy is “scanning” for stocks anticipated to make large moves.
At the beginning of every day, me and my prop traders focus on a few key stocks that we believe look primed for big upside movement. We essentially scan the market by looking for stocks with strong trends that show strong signs of momentum.
These stocks must satisfy three main requirements:
- More than 10% movement in the last seven days
- 300,000 minimum daily average trading volume in the last 10 days
- Minimum share price of $1.50
More Than 10% Movement In The Last Seven Days: In a nutshell, this basically helps us identify stocks with big price movement within a small timeframe. It signals strong recent volatility and momentum, indicating a stock is “in play,” with institutional interest and a higher likelihood of explosive follow-through on catalysts.
300,000 Minimum Daily Average Trading Volume In The Last 10 Days: Volume is a crucial confirmation tool for a stock’s price movement. It’s a strong indicator of buying interest and strength, trend validation, and highlights other reactionary catalysts (earnings reports, economic, geopolitical news, etc.). The metrics for this requirement signal adequate liquidity for quick entries and exits without excessive slippage—allowing prop traders to scale positions, while minimizing the risk of getting stuck in thin trades.
Minimum Price Share of $1.50: Setting a $1.50 minimum share filters out ultra-low-priced penny stocks prone to wide spreads, manipulation, and poor execution. If the first two requirements are confirmed, stock prices above this level could signal cleaner price action and more reliable technical setups for big day trading moves.
Figuring Out The Exact Time To Consider Buying
After we figure out which stocks to watch, we’ll then discuss ideal trade opportunities we see in the market. Now, this step in my Premarket Pulse Pattern strategy is a bit more technical. However, it’s something I routinely cover with my prop traders, because I believe it’s extremely powerful—the real meat and potatoes of this prop trading strategy.
Our goal is to uncover heightened market activity that can help us determine one of two things:
- If a stock could hold its trend and maintain momentum
- If we should anticipate a reversal
We do this using two strategic indicators: Volume, and the VWAP.
Premarket Volume: The Strategic Key

The key for this step is finding stocks with huge premarket volume. Now, I previously mentioned we want stocks with a minimum of 300,000 daily average volume traded in the last 10 days…but once we do this, we apply another level of filtration.
When it comes to finding stocks with optimal entry points, the absolute minimum we want would be 500,000 shares traded—but in reality, we’re ideally looking for no less than 1,000,000-10,000,000+.
The VWAP: Your Prop Trading Volume Indicator
For those unfamiliar with it, the VWAP (Volume-Weighted Average Price) is a trading tool that calculates an asset’s average price—weighted by volume—for a given period. It accounts for volume at each price level. At Funder, the given period we like to use is a single trading day.
For context, a high-volume trade has a greater impact on the average than a low-volume trade. The VWAP can help prop traders identify trends in a stock by showing if its current price is above or below the average price where most trading occurred.
For example: If a stock’s price is above the VWAP, it indicates buyers may be in control. That means the stock is likely trending upward.
If a stock’s price is below the VWAP, it indicates sellers may be in control. That means the stock is likely trending downward.
For prop trading, I like using the VWAP for two main reasons: Intraday use, and identifying optimal entry and exit points.
Intraday Use: The VWAP is primarily used on intraday charts, because it resets at the beginning of each trading day. This makes it extremely effective for day trading—which is how we trade at Funder.
Finding Entry Points: This aligns with the main goal in this part of my Premarket Pulse Pattern strategy. Prop traders can identify ideal entries in a trade, based on how the stock price interacts with bollinger bands set to 21 periods. They might, for example, decide to buy when a stock resumes its previous trend after a pullback.
When To Consider Entering A Trade
Like I mentioned earlier, we use the Premarket Pulse Pattern strategy to identify potential prop trading opportunities in stocks that look poised for strong intraday movement. I just outlined the two main indicators we use for finding intraday trading opportunities—volume and the VWAP. Now, I’ll walk you through an example of what one looks like.
AAPL Trade Example
Here’s one instance, where we anticipated an ideal intraday trade opportunity in Apple Inc. (AAPL):

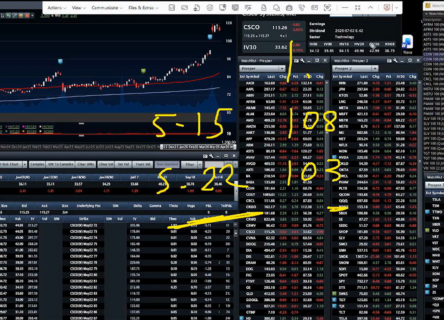
AAPL showed huge premarket volume, so we decided to take a look. Once a stock meets our requirements, we always pull up the chart. Now, for context—what you’re looking at here is a one-day, one-minute chart.
The VWAP is represented by the purple line. I set up one standard deviation above (red line) and below (green line) for the bollinger bands. This basically measures the range a stock price typically moves, relative to a basic moving average. The price typically stays within this range 68% of the time, indicating normal activity.
We’re looking for the stock price to swerve inside or outside that channel. In the picture above, it happens right where I have the yellow arrow. The stock price swerves outside of the channel just before 10AM ET—30 minutes after the open.

Here’s a closeup of the exact time AAPL swerved outside of the channel. The yellow arrow shows where AAPL had a small pullback right after the open.
The candles briefly got stuck within the channel—but the green arrow shows where the candles finally started to break out of that channel.
This was our indicator that AAPL was just starting to break out—signaling a good time to buy.

As you can see, AAPL continued to break out, and proceeded to gain over 7% that day.
Closing Thoughts: Something To Consider
With that AAPL example still in mind, there’s something I want you to think about for a second…
Some of our prop traders netted solid profits off this trade. If you went in with $1,000, you could have potentially netted a $70 return, which is pretty good for day trading regular stocks…
But, if you were trading options…your profit potential could have potentially multiplied!
What I love about Funder is our prop trading firm can help traders by potentially giving them access to more buying power. This can help them take potential advantage of opportunities like this while using up to $250,000 of buying power as a funded trader.