The artificial intelligence trade roared back to life this week with solid earnings, and increased spending plans. That was for three of the market’s four largest hyperscalers that stoked a massive rebound in chip stocks. There was also the biggest one day-gain for South Korea’s Kospi index on record.
Microsoft added $450 billion in value on Thursday—its best day since 2008 and the largest single-day increase in any company’s market value ever—after it topped Wall Street’s forecasts and remained committed to its AI outlook.
Amazon added almost $375 billion in value after earnings and spending outlook were released after the close of the market Thursday.
But that didn’t keep the S&P 500 from ending with its first July loss since 2014. A painful decline for semiconductor stocks highlighted a tough July for the stock market.
Even with a 9% surge Thursday and Friday, the iShares Semiconductor ETF, which holds stocks of 30 chip makers and associated companies, was down 22.1% for July. That made for the worst month for SOXX since it tumbled 23.3% in December 2002, according to FactSet data. But the ETF was still up 67.7% for 2026.
And what about the Fed? Where are interest rates headed? We heard a bunch of rhetoric on Wednesday from new Fed Chief Kevin Warsh who left the markets with more questions than answers (more on that below).
July Non-Farm Payroll data will be released this Friday and a batch of corporate results this week will keep equity investors on edge over the direction of the stock market, which has been buffeted by geopolitical tensions, uncertain interest-rate policy and sizable moves in heavyweight technology shares.
For the week, the DOW gained +1.0% to 52,485, the S&P 500 added +1.1% to 7,490, the Nasdaq rallied +1.6% to 25,374 and the Russell 2000 eked out a gain of +0.1% to 2,932. The CBOE VIX decreased by -13.9% to 15.99.
What’s Next for the Fed?
We can certainly say one thing about Wednesday’s FOMC press conference – it moved markets. Treasury bonds, which are most closely tied to Fedspeak, reacted somewhat violently, leading to a significant steepening of the yield curve in less than an hour. Stocks responded negatively, seemingly to the abrupt rise in long-term yields, though some of the fall seems attributable to a hedge fund blowup that was revealed Wednesday morning.
Put simply, bond traders doubted Chair Warsh’s resolve. While he appeared to paint himself as a single-mandate Chair, focused primarily on “stable prices” (the term “inflation” was mentioned 41 times) during the press conference, over “full employment” (mentioned only three times by Warsh), fixed income investors felt that there was insufficient concrete proof of definitive measures toward achieving that goal.
The two day move in the yield curve was severe. The steepening of the yield curve is evident, with 3-month yields falling by about 10 basis points while 10-year and 30-year yields rose by about 5 and 12 basis points, respectively. The sharp steepening of the US Treasury yield curve has raised fresh concerns about the central bank’s credibility and its willingness to take more decisive action against inflation.
Analysts say the combination of falling short-term Treasury yields and rising long-term yields suggests that investors are becoming increasingly skeptical that the Fed will raise interest rates again, despite Chair Kevin Warsh’s insistence that policymakers “will not hesitate to act” if inflationary pressures persist.
A steeper yield curve is often interpreted as a sign that markets expect lower interest rates in the future or see little need for additional policy tightening.
Under normal circumstances, a so-called “bear steepener” occurs when yields rise across the curve, with long-term yields increasing faster than short-term yields.
This time, however, the market experienced a much less typical pattern: short-term yields declined while long-term yields continued climbing, highlighting a sharp divergence in investor expectations for monetary policy.

The Big Mac Index
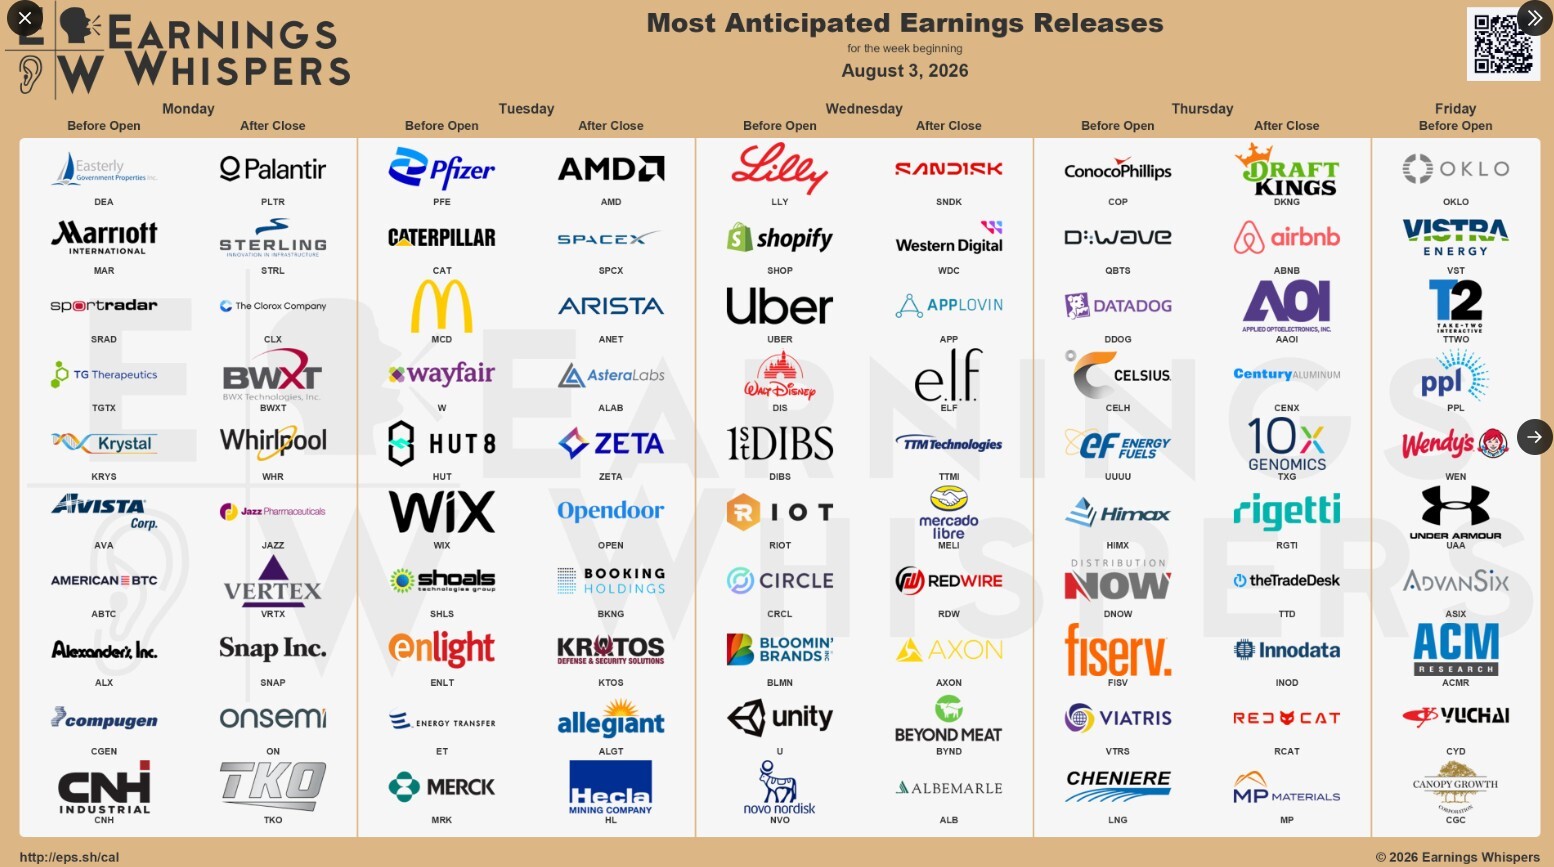
Yes – McDonald;s reports earnings this week on Tuesday morning. Fun fact – I have never eaten a Big Mac in my life (though I used to indulge in the Quarter Pounder). So why am I writing about this 580 calorie (that’s what they say) burger?
Happy 40th Birthday to the BIG MAC INDEX. In the current era of deglobalization, trade imbalances, forex manipulation, geopolitical strife and of course tariffs, an impartial analysis of a currency’s real value is more important than ever. Where does the real value of the dollar stand against other currencies?
The original notion of the index came to its author, Pam Woodall in 1986. She said that the value of a currency should reflect its purchasing power and the best way to assess this was to use one “perfect universal commodity” — the Big Mac. And whether you love ’em or prefer the Whopper, the iconic Big Mac burger is pretty much identical the whole world over. It has the same ingredients — from beef to xanthan gum — but of course the inputs, such as property rates and labor costs, vary widely from country to country.
Four decades later, Woodall’s idea has become a standard measure of purchasing-power parity (the real buying power of a currency), and tells us that the world’s most expensive burger is currently flipped on a Swiss grill at the equivalent of $9.04, while the cheapest is on offer in Indonesia at $2.38. The second cheapest burger globally is the Taiwanese offering at $2.42.
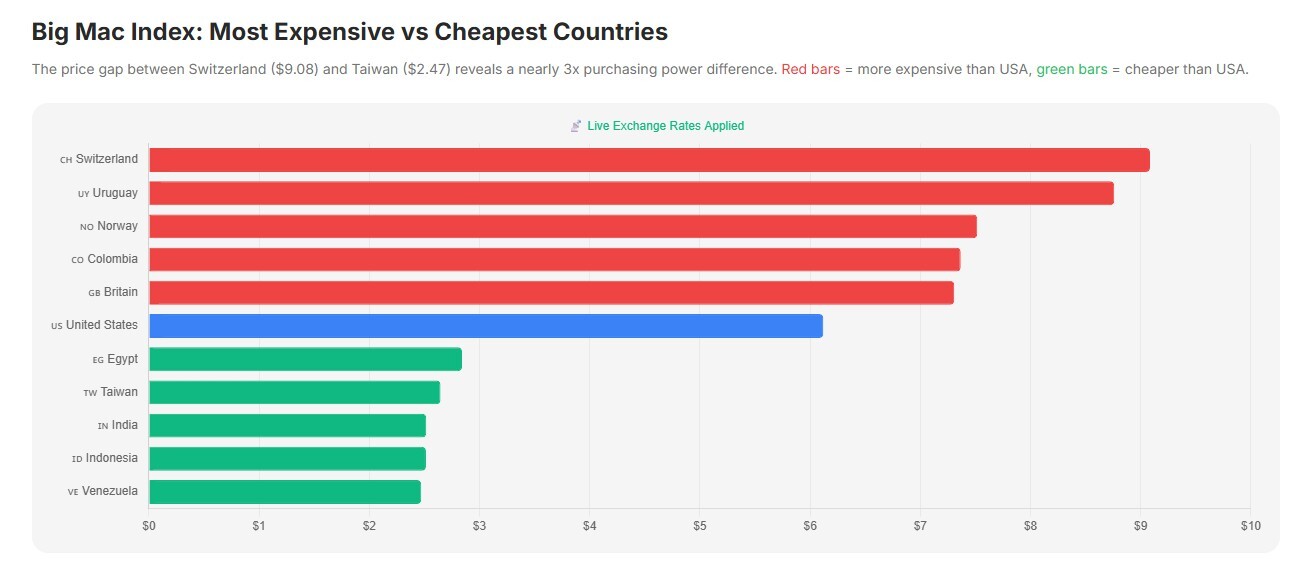
So what The Economist’s Big Mac Index demonstrates right now, in the most general terms, is that Asian currencies are cheap against the dollar, while the euro, sterling and the Swiss franc in particular, are expensive.
What Is the Big Mac Index?
- The Big Mac Index is an informal measure of purchasing power parity developed by The Economist in 1986 that compares the price of a McDonald’s Big Mac across countries.
- The index uses the U.S. Big Mac price as a baseline to determine whether currencies are overvalued or undervalued relative to the dollar.
How Much Does a Big Mac Cost?
- A Big Mac costs an average of $5.79 in the United States, which serves as the baseline for comparing prices across countries.
- Big Mac prices range from $2.38 in Taiwan to $7.99 in Switzerland, reflecting differences in purchasing power, currency valuation, and local operating costs.
Most Expensive Big Mac
- Switzerland has the most expensive Big Mac at $7.99. The three countries with the highest Big Mac prices are Switzerland ($7.99), Argentina ($6.95), and Uruguay ($6.91).
- The most expensive Big Mac markets tend to be high-cost economies where wages, rent, and operating expenses push fast-food prices well above the U.S. baseline.
Cheapest Big Mac
Lower Big Mac prices often reflect lower local purchasing power and operating costs, which is why lower prices do not necessarily mean a currency is stronger
Taiwan has the cheapest Big Mac at $2.38. The three countries with the lowest Big Mac prices are India ($2.62), Indonesia ($2.54), and Taiwan ($2.38).
More than halfway through the Q2 earnings season, the S&P 500 is reporting impressive results, even if one excludes the unusually large EPS surprises reported by Alphabet and Amazon.com. Overall, both the percentage of S&P 500 companies reporting positive earnings surprises and the magnitude of earnings surprises are above recent averages.
Overall, 61% of the companies in the S&P 500 have reported actual results for Q2 2026 to date. Of these companies, 86% have reported actual EPS above estimates, which is above the 5-year average of 78% and above the 10-year average of 76%. If 86% is the actual number for the quarter, it will mark the highest percentage of S&P 500 companies reporting a positive EPS surprise since Q2 2021 (87%).
Economic Reports of Note (All Times EST):
Monday
9:45 am – US: S&P Global Manufacturing PMI
10:00 am – US: ISM Manufacturing PMI
10:00 am – US: Construction Spending
11:30 am – US: Atlanta Fed GDPNow
11:30 am – US: 3 & 6-month Bill Auction
Tuesday
8:30 am – US: Trade Balance
8:55 am – US: Redbook
10:00 am – US: JOLTS Job Openings
10:00 am – US: Factory Orders
10:00 am – US: Durables
11:30 am – US: Atlanta Fed GDPNow
11:30 am – US: 52-week Bill Auction
2:00 pm – US: Total Vehicle Sales
Wednesday
5:00 am – EU: PPI
7:00 am – US: Mortgage Data
8:15 am – US: ADP Nonfarm Employment Change
9:45 am – US: S&P Global Composite & Services PMI
10:00 am – US: ISM Non-Manufacturing PMI
10:30 am – US: Crude Oil Inventories
11:35 pm – JAP: 30-year JGB Auction
Thursday
5:30 am – US: Challenger Job Cuts
8:30 am – US: Weekly Jobless Claims
10:00 am – US: Wholesale Inventories
11:30 am – US: Atlanta Fed GDPNow
11:30 am – US: 4 & 8-Week Bill Auctions
Friday
8:30 am – US: July Nonfarm Payrolls
10:00 am – US: FOMC Member Barkin Speaks
11:00 am – US: NY Fed 1-year Consumer Inflation Expectations