As trading becomes more cutting edge, Artificial Intelligence (A.I.) is emerging as one of the biggest drivers that’s changing how people navigate this landscape. Tools like Artificial Intelligence trading software have abilities to find high profit potential trades in ways that us humans cannot physically do on our own.
What Indicators Help AI Find High Profit Potential Trades?
One of Artificial Intelligence’s key strengths lie in its ability to simultaneously incorporate and analyze an array of technical indicators for finding high profit potential trades. Some of the most common technical indicators A.I. Trading software uses include moving averages – like the Exponential Moving Averages (EMAs) and Simple Moving Averages (SMAs). Other popular ones include momentum indicators like the Relative Strength Index (RSI).
AI trading software – like the A.I. Trade Finder, for example – analyze thousands of stocks with these indicators at once. They help the A.I. Trade Finder determine if a stock satisfies specific requirements that reveal if certain trade setups were triggered in them – identifying timely opportunities for making potential high profit trades. The A.I. Trade Finder program is ran by Charlie Moon, a trading coach with over 20 years experience, who’s been featured on prominent financial news outlets like Fox Business, BNN Bloomberg, and TD Ameritrade.
Charlie published a free A.I. trading guide that provides detailed explanations on how A.I.-backed software uses these indicators to scan thousands of stocks for high profit potential trades every single day. Click here to check it out.
Main Takeaways
- A.I. trading software uses several different technical indicators to identify high profit potential trades in real time
- In order to find out how A.I. trading software uses these indicators, it’s important to understand the specific functions of each one
- Three technical indicators A.I. trading platforms commonly use are the SMA, EMA, and RSI
Three Key Indicators The A.I. Trade Finder Uses
In order to better grasp how software like the A.I. Trade Finder identifies high profit potential trades with these three key indicators, you must understand how each one works. It’s important to find out the specific data each indicator gathers, and what they’re supposed to tell us about a stock.
Simple Moving Average (SMA)
The Simple Moving Average is designed to identify what direction a stock is trending over a certain period of time. It finds this information by calculating a stock’s average closing price of each day equally within the specified timeframe. The SMA offers a smoothed representation of price movements – meaning it filters out short-term fluctuations and highlights broader trends. By providing a stable and straightforward way of interpreting visual representation on a price chart, the SMA allows traders to identify potential existing or reversing trajectories.
Exponential Moving Average (EMA)
Unlike SMAs, the Exponential Moving Average gauges what direction a stock is trending by putting more emphasis on recent stock price movements. While the SMA equally factors in a stock’s prices within its selected timeframe, EMAs put more weight to recent stock prices – meaning they have greater influence and significance compared to older figures in a dataset. This focus on recent data allows the EMA to reflect current price trends in a stock more dynamically.
Relative Strength Index (RSI)
While SMAs and EMAs are primarily designed for indicating directional trends in stocks, the Relative Strength Index analyzes momentum to evaluate the speed and magnitude of price movements. RSI measures the ratio of average gains to average losses over a specified period – typically 14 days. It generates values between 0 and 100. Levels above 70 indicate a stock may be overbought. Levels below 30 could signal a stock is oversold.
How The A.I. Trade Finder Uses These Indicators
The A.I. Trade Finder scans for specific trade setups that were triggered in a stock. Every morning, the Trade Finder simultaneously scans thousands of stocks. It uses these indicators to find out if stocks meet certain requirements that determine if a trade setup was triggered. In layman’s terms – a stock price has to stay above or below a certain number of indicators within specified timeframes to meet this criteria.
In many cases, this checklist of conditions – in relation to the pertinent indicators being applied – have to happen all at once to trigger a trade setup. The Trade Finder then aggregates historical data to zero in on which stocks generated the highest win rates and cumulative returns within a specified timeframe after triggering one of these trade setups.
Here’s an example…
When Charlie first started using the A.I. Trade Finder, it identified a trade setup called the “Bullish Burst” that was recently triggered in Visa (V)…
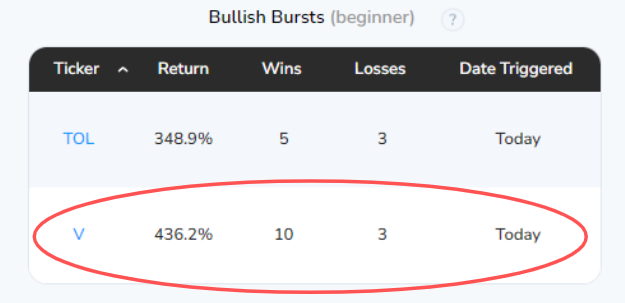
As you can see, over the last 13 times this setup was triggered in Visa, it produced 10 winning trades – and generated a cumulative return over 436%.
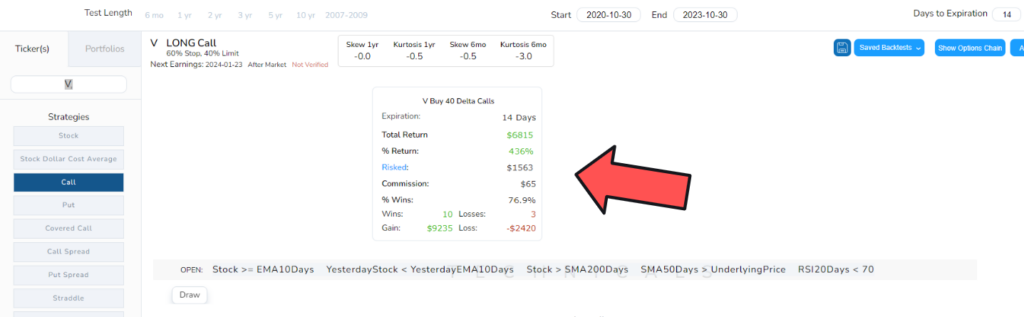
When you click on Visa, the Trade Finder brings you to this page. This section provides a more detailed breakdown of these metrics. It also maps out how to consider making the trade…but the most important information on here is that gray bar…

This bar lays out every piece of required criteria that triggered the Bullish Burst trade setup in Visa. Here are all the requirements better explained:
- The stock price needs to be above the EMA for the last 10 days
- The previous day’s stock price needs to be below the previous day’s 10-day EMA
- The stock price must be above the 200-day SMA
- The 50-day SMA must be greater than the underlying price
- The 20-day RSI needs to be below 70
Now that you found out which requirements were satisfied for the Bullish Burst setup – along with how the A.I. Trade Finder recommends you make this trade – here’s how Visa wound up moving…
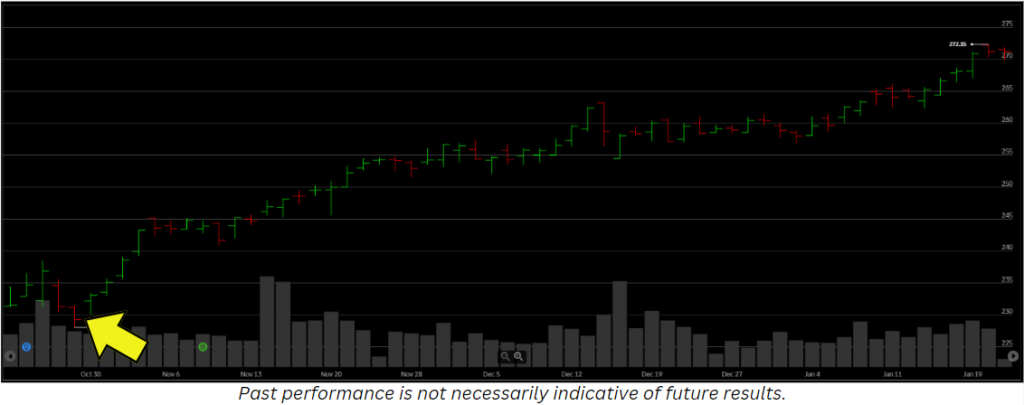
The yellow arrow shows where the Bullish Burst setup was triggered in Visa. As you can see, it produced another winning trade – marking 11 times this happened in the last 14 instances it was triggered in Visa. Charlie’s guide has more information on how A.I. trading software uses these indicators to identify high profit potential trade opportunities – click here to check out Charlie’s free guide.
Conclusion
Technical indicators play a pivotal role in an A.I. trading software’s ability to find high profit potential plays. These programs use a variety of different tools and indicators to identify these potential trading opportunities, so it’s important to understand how these indicators specifically work, and how you can use the data each one generates.
- Purpose: Every technical indicator A.I. trading software uses to find high profit potential trades is designed to gather a specific dataset.
- Selection: While some indicators are used more often than others, every trade setup typically requires different ones to satisfy their specific criteria
- Requirements: Confirming a triggered trade setup requires the stock price to be above or below certain indicators – usually all at once – within certain timeframes.
While these indicators provide critical information for A.I. trading software to use – always remember these calculations don’t guarantee a stock will move the way it’s expected. We always advise doing thorough research on the AI trading platform you’re considering, and how they use specific indicators to find potential high profit trades.