

Markets shifted decisively during the week from an AI capex earnings-driven backdrop to a more macro-driven and uneven tape.
Rates, inflation, petroleum, and Federal Reserve expectations moved back to center stage, with all major equity indexes under pressure.
The biggest market driver was the renewed surge in crude oil. Heading into what is likely to be the year’s most anticipated and debated Federal Reserve meeting, oil prices briefly moved into triple digits, with U.S. WTI crude crossing $100 a barrel and Brent approaching $110 before retreating some late in the week. That surge posed a question: would rising oil be enough to tip the Fed into hiking rates?
Friday’s CPI report suggests the answer is yes, and the markets agree. A hotter-than-expected core reading showed inflation pressures spreading beyond energy, strengthening the case for a near-term policy response and reviving the “higher for longer” narrative. The question is no longer simply whether the Fed hikes next week. It is whether this is the start of a longer tightening path, and what that means for portfolios. (More on that below).
For the week, the DOW lost -1.6% to 52,573, the S&P 500 closed lower by -0.8% gain to 7,657, the Nasdaq declined -0.7% to 26,333 and the Russell 2000 slumped -2.4% to 2,904. The CBOE VIX rose +9% to 15.84.

What’s the Difference Between a “C” and a “P”
There are two inflationary measures in our economy, the Consumer Price Index (CPI) and the Producer Price Index (PPI). CPI is a measure of the total value of goods and services consumers have bought over a specified period, while PPI is a measure of inflation from the perspective of producers.
Both PPI and CPI are considered key data releases, meaning the monthly indicator is heavily scrutinized by traders, since they are used by the Federal Reserve to assess developments in the economy.
The Federal Reserve is a dual-mandated central bank, which means it is under considerable pressure to strike a balance between inflation and the jobs market. As a result, any unexpected fluctuations in leading economic indicators are often referenced by members of the Fed during speeches or public events in order to manage market expectations.
Since PPI measures the costs of producing consumer goods, and commodity and food prices directly affect retail pricing, PPI is seen as a good pre-indicator of inflationary pressures.
Understanding the Consumer Price Index (CPI)
The Consumer Price Index is one of the most widely followed economic indicators globally. It measures the average change in prices paid by consumers for a basket of goods and services over time. This basket includes essential spending categories such as housing, food, transportation, healthcare, and energy.
Many traders researching macroeconomic indicators ask: why does CPI receive so much attention from central banks and financial markets? The answer lies in its direct connection to the cost of living. Rising consumer prices indicate inflationary pressure, which can influence how central banks set interest rates.
When CPI rises faster than expected, markets often anticipate tighter monetary policy as central banks attempt to control inflation. Higher interest rates can strengthen a country’s currency because investors seek higher returns on interest-bearing assets.
Conversely, lower-than-expected CPI readings may indicate weakening inflation pressures. This can lead markets to anticipate looser monetary policy, which may weaken a currency relative to others.
Because CPI reflects the prices consumers experience daily, it often receives significant attention in economic policy discussions.
Understanding the Producer Price Index (PPI)
While CPI measures inflation at the consumer level, the Producer Price Index focuses on price changes experienced by producers and manufacturers. PPI tracks the average change in selling prices received by domestic producers for their goods and services.
This leads many traders to ask: why do economists monitor producer prices when analyzing inflation trends? The reason is that PPI often acts as a leading indicator of future consumer inflation.
When production costs increase for businesses, companies may eventually pass these higher costs on to consumers through higher retail prices. This means rising PPI data can sometimes signal future increases in CPI.
For example, if raw material costs rise significantly for manufacturers, those costs may gradually move through the supply chain. Eventually, higher production costs appear in the prices consumers pay.
Because of this relationship, traders often watch PPI data to anticipate future changes in consumer inflation.
One of the most common questions traders ask is whether CPI or PPI has a stronger impact on financial markets. In most cases, CPI tends to move markets more significantly than PPI.
The primary reason is that central banks typically focus on consumer inflation when determining monetary policy. Because CPI directly reflects consumer price levels, it plays a more prominent role in policy decisions.
When CPI data surprises markets significantly, currencies, bond yields, and stock indices often react immediately. Traders quickly adjust their expectations about interest rates and economic conditions.
PPI data can also move markets, particularly when it diverges significantly from expectations. However, its influence is often more indirect because it signals potential future inflation rather than current consumer price levels.
For traders analyzing inflation trends, monitoring both indicators together provides a more complete picture of economic conditions.

The Fed is Running Out of Reasons to Wait
Who doesn’t like a Tom Petty reference?
When the Fed meets this week, they will have to weigh a healthy labor market against still-elevated inflation. On employment, the picture is solid, at least for now: the August jobs report showed a labor market consistent with full employment, as Fed Chair Kevin Warsh recently noted. Unemployment sits at 4.1%, job gains were broad, and 3.1% wage growth isn’t inflationary once the productivity pickup is factored in. That side of the mandate looks largely achieved.
Inflation is the harder half. It has now run above the Fed’s 2% target for more than five years, and recurring shocks, from supply chains to tariffs to energy, aren’t helping. Rate hikes won’t solve higher oil prices, but policymakers may be growing less willing to look through supply-driven inflation pressures after years of running above target.
While Main Street is definitely feeling the effrects, interest rates also don’t appear to be restricting the economy much beyond housing at current levels. Looking ahead, high oil prices effectively act as a tax on consumers, potentially weighing on discretionary spending and broader activity. Still, the economy retains important buffers. The labor market continues to support consumers, with layoffs remaining subdued, as reflected in timely jobless claims data, while structural changes in the U.S. economy have reduced its sensitivity to oil-price shocks compared with prior decades. The ongoing AI infrastructure buildout is also helping support growth and business investment.
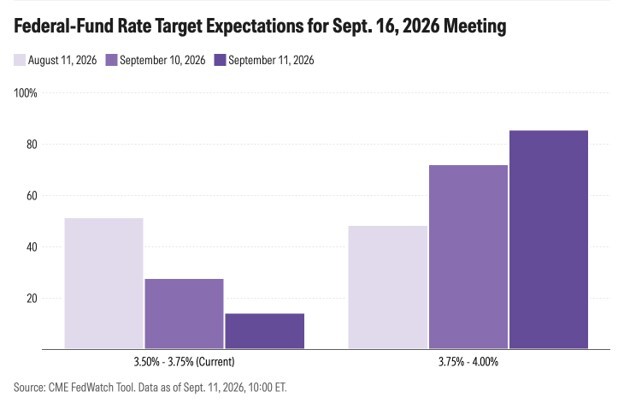
Put simply, the Fed may be running out of patience, and market pricing is starting to reflect that, with the probability of a September rate hike rising to 90%. The Fed is not alone in this shift: the ECB has already hiked a quarter point, and other central banks are becoming more hawkish as well.
Economic Reports of Note (All Times EST):
Monday
8:30 am – CAN: CPI
11:30 am – US: 3 & 6-month Bill Auctions
Tuesday
8:15 am – US: ADP Employment Change
8:30 am – US: NY Empire State Manufacturing Index
8:55 am – US: Redbook
1:00 pm – US: 20-year Bond Auction
Wednesday
2:00 am – UK: CPI & PPI
7:00 am – US: Mortgage Data
8:30 am – US: Retail Sales
10:00 am – US: Retail Inventories
10:00 am – US: NAHB Housing Market Index
10:30 am – US: Crude Oil Inventories
11:30 am – US: Atlanta Fed GDPNow
2:00 pm – US: Fed Interest Rate Decision
2:30 pm – US: FOMC Statement
Thursday
5:00 am – EU: CPI
7:00 am – UK: Bank of England Interest Rate Decision
8:30 am – US: Weekly Jobless Claims
8:30 am – US: Philadelphia Fed Manufacturing Index
8:30 am – US: Housing Starts & Building Permits
10:00 am – US: Atlanta Fed GDPNow
10:00 am – US: Pending Home Sales
11:30 am – US: Atlanta Fed GDPNow
11:30 am – US: 4 & 8-Week Bill Auctions
1:00 pm – US: 10-year TIPS Auction
10:30 pm – JAP: Bank of Japan Interest Rate Decision
Friday
9:15 am – US: Industrial & Manufacturing Production
9:15 am – US: Capacity Utilization