

After dropping on Friday ahead of the holiday weekend, the S&P 500 ended the week with a slim gain and was about 1% shy of its mid-August record high. Equities were jostled by changes in rate-path expectations and concerns that rising U.S. Treasury yields could trip up Wall Street’s rally.
Markets have been consumed in recent weeks by the prospects of a rate increase at the Fed’s next meeting on September 15 to 16. Such bets ramped up after a sppech late last month from Fed Chairman Kevin Warsh that signaled the central bank might have to act if inflation remains high, and the case for a hike built on Friday after a much stronger than anticipated labor market report.But the potential for such a rate move remained up in the air.
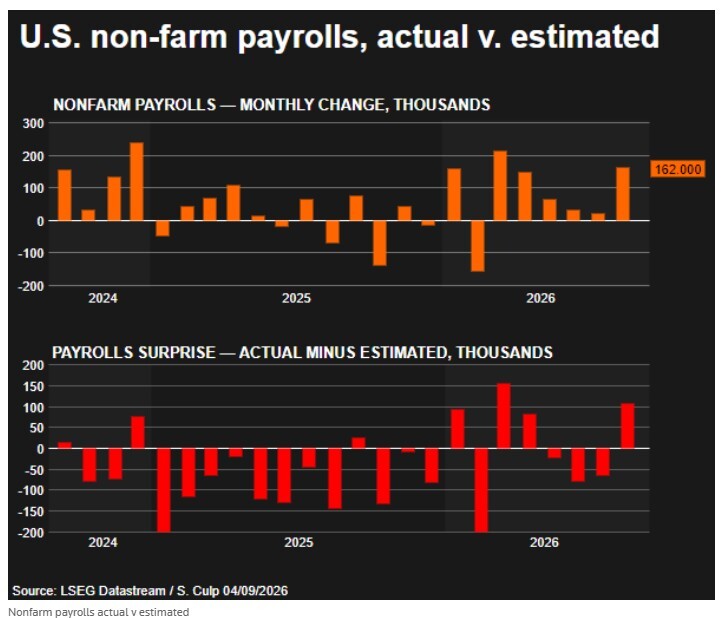
The Labor Department’s August employment report showed the U.S. economy added 162,000 jobs last month, nearly three times the 56,000 consensus, while the department revised June and July payrolls upward by a total of 55,000 jobs. Labor market participation increased while the unemployment rate held firm at 4.1%.
While a stronger-than-expected jobs report would generally be good economic news, markets are interpreting it as a sign the data-dependent Fed will implement a rate hike at the conclusion of this month’s policy meeting to curb war-related energy price pressures from morphing into broader, more systemic inflation.
Investors will zero in on inflation data this week that they say could determine whether the U.S. Federal Reserve hikes interest rates later in the month.
For the week, the DOW lost -0.3% to 53,414, the S&P 500 eked out a +0.1% gain to 7,719, the Nasdaq rallied by +0.4% to 26,507 and the Russell 2000 edged higher by +0.1% to 2,976. The CBOE VIX added +0.7% to 14.53.
PPI, CPI TO FLESH OUT INFLATION PICTURE
Data on producer prices will give investors an initial glimpse at August’s inflation trends during the holiday-shortened week, with U.S. markets closed on Monday for Labor Day.
Thursday’s Producer Price Index report comes a day ahead of the CPI data. Economists polled by Reuters expect a 0.4% monthly rise in August CPI, and a 0.2% rise in the core measure, which excludes the volatile food and energy components.
Inflation has for several years run consistently above the Fed’s 2% annual target. But lasst month’s CPI reading showed prices barely increased.
HIKE ODDS NEAR 50/50
Odds of an interest-rate hike fell on Thursday, following comments from Fed Governor Christopher Waller that he is inclined to argue in favor of keeping interest rates steady if upcoming data confirms inflation pressures are cooling Then they rose again on Friday after the blowout August employment report. Late on Friday, fed funds futures suggested a 57% chance the central bank would hike at its next meeting.
The prospect of tighter monetary policy could undercut stock performance in several ways, including by raising borrowing costs that slow the economy. Rate hikes that translate into higher Treasury yields could create more investment competition from bonds and pressure equity valuations.
The benchmark 10-year Treasury yield edged up to 4.78% late on Friday, moving toward the 5% yield investors have flagged as a worrisome level for equities.

Do You Remember…
I had to add this – probably one of the best songs ever. So what is so speacial about September and the markets?
Another song which might reflect historical September results is the Green Day song “Wake Me Up When September Ends.” When it comes to the stock market, there are periods of seasonality. One of the most well-known seasonal trends in recent years has been September being the worst month for broad market indexes. Market experts point to trends suggesting this year is an exception to the rule.
Why? Midterm Elections. The four best September returns ever all took place in a midterm year and five of the top seven.
Here are the best September returns since 1950:
- 2010: +8.8%
- 1954: +8.3%
- 1998: +6.2%
- 1950: +5.6%
- 1996: +5.4%
- 1997: +5.3%
- 1958: +4.8%
- 1995: +4.0%
- 1973: +4.0%
- 1988: +4.0%
The bolded years above are midterm election years (2010, 1954, 1998, 1950, 1958) and represent some of the best September returns for the market since 1950.
In addition, the 10 best September returns since 1950 usually came when the S&P 500, tracked by the SPDR S&P 500 ETF Trust (SPY), was already up year-to-date through August. The SPDR S&P 500 ETF Trust is up 12.6% year-to-date in 2026 as of the time of writing.
Here are the 10 best Septembers, with the YTD return through August and eventual September return:
1997: +21.4% through August, +5.3% September
1958: +19.4% through August, +4.8% September
1995: +22.3% through August, +4.0% September
1973: -11.7% through August, +4.0% September
1988: +5.8% through August, +4.0% September
2010: -5.9% through August, +8.8% September
1954: +20.2% through August, +8.3% September
1998: -1.4% thorugh August, +6.2% September
1950: +9.7% throught August, +5.6% September
1996: +5.9% through August, +5.4% September
Ouch
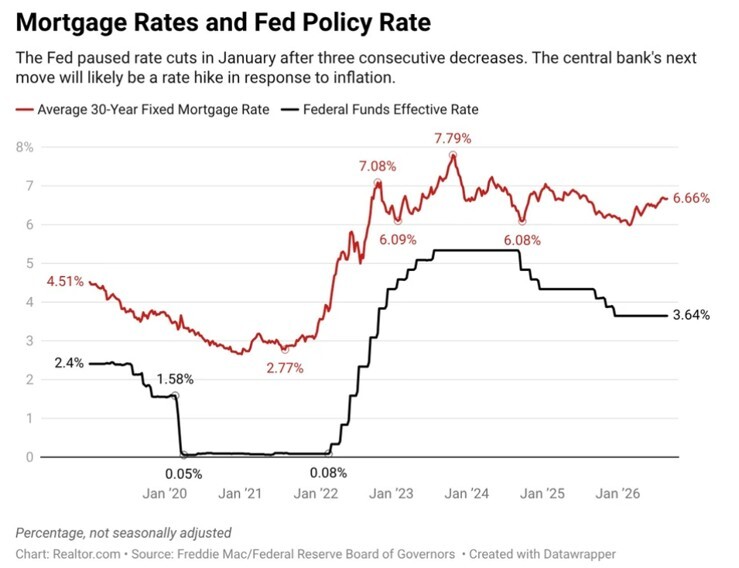
Stubbornly high mortgage rates finally took their toll on buyer demand in August, snapping an eight-month streak of pending sales growth even as sellers slashed prices.
The share of listings in pending status fell 0.2% from a year ago, marking the first negative readout since November 2025, according to the latest Realtor.com monthly housing market trends report released on Wednesday. A sale is listed as pending when a seller has accepted an offer from a buyer, but the deal has not yet closed. The pending home sales rate is a crucial indicator of the housing market’s health because it helps predict the rate of finalized home sales a month or two later.
Pending sales have been losing steam since May, when the growth rate reached a selling-season peak of 4.8%. That coincided with a steady climb in mortgage rates driven by the ongoing conflict in the Middle East, which put upward pressure on oil prices and fueled inflation fears.
The average rate on 30-year fixed home loans hit its 2026 high of 6.71% last week, according to Freddie Mac. “It looks like August was the month where higher mortgage rates really caught up to housing demand,” says Realtor.com senior ecomomist Jake Krimmel, noting that rates crossed above their year-ago levels in early August. Krimmel adds: “A year ago at this time, rates were declining, so that year-over-year comparison might just get uglier in the coming months.”
Benjamin Cohen, managing director and senior vice president of mortgage lending at Rate, says retreating pending sales reflect the market’s persistent affordability challenges.
“Buyers understand rates aren’t going back to 3%, but when you combine today’s rates with home prices, taxes, and insurance, the monthly payment can still be tough to justify,” Cohen tells Realtor.com. “When rates moved higher again this summer, it caused some buyers to pause, while others believe the short-term affordability factor will improve when we find stability in the markets.”
Economic Reports of Note (All Times EST):
Monday- US Markets Closed for Labor Day
5:00 am – EU: GDP
7:50 pm – JAP: GDP
Tuesday
6:00 am – US: NFIB Small Business Optimism
8:15 am – US: ADP Employment Change
11:00 am – US: NY Fed 1-Year Consumer Inflation Expectations
11:30 am – US: 3 & 6-month Bill Auctions
1:00 pm – US: 3-year Note Auction
Wednesday
7:00 am – US: Mortgage Data
8:55 am – US: Redbook
1:00 pm – US: 10-year Note Auction
Thursday
8:15 am – EU: ECB Interest Rate Decision
8:30 am – US: PPI
8:30 am – US: Weekly Jobless Claims
10:00 am – US: Existing Home Sales
10:00 am – US: Wholesale Inventories
11:30 am – US: Atlanta Fed GDPNow
11:30 am – US: 4 & 8-Week Bill Auctions
Friday
2:00 am – UK: GDP
8:30 am – US: CPI
10:00 am – US: Michigan Consumer Sentiment & Inflation Expectations
11:00 am – US: Cleveland CPI
2:00 pm – US: Federal Budget Balance