
This is the one week the entire Prosper roster is in the same room. Three days at The Wynn Las Vegas Resort – nine coaches, headline guests, live trading, and a floor full of traders leveling up together.

SECTOR ROTATION
As earnings reports put a spotlight on how the AI buildout is being financed, and oil price risk jarred markets, tech stocks slumped this past week and defensive and cyclical stocks moved higher. The sell-off in AI related stocks continued last week, with the Philadelphia Semiconductor Index down 4%, bringing its total decline over October so far to 15%.
This rout weighed on the Nasdaq, which is down over 3% this month, and hit international equity markets with concentrations in tech hard, with the Chinese CSI 300 in bear-market territory, and the Korean Kospi now down 40% from June. A rotation to safe havens, including strong industrial earnings, helped to lift the Dow Jones Industrial Average 0.41% for the week. (More on that below).
With more Middle East violence and uncertainty, WTI crude spiked nearly 4% to more than $103 Friday and rose more than 4% on the week. Third-quarter earnings results were mixed. SpaceX reported on 161% revenue growth and confirmation of Tesla merger discussions. Netflix fell on its slowest sales growth in three years. Meta beat on revenue and raised guidance but fell on increased CapEx and a legal charge. Tesla beat on profit but disappointed on capex guidance. And consumer confidence edged lower to a near record low in October.
This week is a crucial one, with corporate earnings reports led by major AI players and a Federal Reserve meeting posing critical tests for a suddenly shaky market rally. Three other hyperscalers – Google, Microsoft and Amazon headline a packed week of quarterly results, including about one-third of S&P 500 companies. The Fed’s interest rate policy meeting on Wednesday also could rattle markets.
Investors also have their focus trained on the US midterm elections on November 3, with growing bets that the Democrats will take control of the US Congress away from President Donald Trump’s Republican party. The series of market catalysts could ratchet up volatility over the next couple of weeks and challenge optimism that has helped lift the benchmark S&P 500 index up 11% in 2026.
For the week, the DOW gained +0.4% to 52,215, the S&P 500 fell -0.5% to 7,624, the Nasdaq lost -0.7% to 25,955 and the Russell 2000 flipped and added +2% to 2,776. The CBOE VIX dipped -2.7% to 19.45.

The Market is Playing Defense
Hedge funds have loaded up on stock shorts this month, pushing bearish bets near a five-year high and raising the risk of a sharp squeeze if markets rebound. Across global equities, Goldman Sachs Group’s prime brokerage desk says short sales have exceeded long purchases by a ratio of roughly five to one. Short leverage across its book sits in the 99th percentile over the past five years. Net leverage among fundamental long/short funds, a gauge of how much long exposure exceeds shorts, is near a three-year low, despite a rise in gross leverage.
The retreat follows a sharp unwind in the AI trade. A hotter-than-expected US inflation print and renewed doubts over the payoff from heavy spending on AI capacity have triggered selling in semiconductor and infrastructure names.
Global information technology stocks saw their heaviest two-week net selling in more than a decade of the desk’s records in the period through Oct. 16. Net allocation to a Goldman Sachs basket of global AI stocks sits in the 38th percentile over the past year, while the group’s long/short ratio is in the sixth percentile. Therefore, any catalyst that lifts tech shares from here would run into short positions that need to be bought back.

This chart shows a market rotation away from the technology and communications services sectors towards more defensive parts of the market like healthcare, utilities and consumer staples, with the S&P 500 aggregate broadly stable.

What Happened to the Bond Market?
Otherwise, the big winner from the AI sell-off was the bond market. The benchmark 10-year Treasury rallied hard last week, driving the yield back below 5% from a recent high of 5.3%. In part this reflected a flight-to-safety move amid rising market volatility, but the rally could also indicate growing nervousness around the growth outlook amid a wobble in the AI sector. The reversal in bonds this week emerged as questions persisted about the billions being spent to build artificial intelligence networks.
The benchmark 10-year US Treasury yield — used to price mortgages, auto loans and credit card debt — slid more than 17 basis points to 4.972%, the first time below 5% since Sept. 23. The yield saw its biggest one-day decline since March 10, 2023.
The yield on the 2-year Treasury note, which closely tracks short-term Federal Reserve rate policy, tumbled more than 16 basis points to 4.659%. The yield on longer-dated 30-year US Treasury — most sensitive to geopolitical developments — was more than 14 basis points lower at 5.296%.
This week’s rebound in Treasury prices marks a turnaround from earlier this month, when 10- and 30-year yields reached their highest levels in more than two decades amid investor concern over inflation and high energy prices.
One basis point equals 0.01%, or 1/100th of 1%, and yields and prices move inversely to one another.
About a quarter of the way through the third quarter earnings season, the S&P 500 is reporting mixed results relative to expectations. While the percentage of S&P 500 companies reporting positive earnings surprises is above recent averages, the magnitude of earnings surprises is below recent averages. As a result, the index is reporting slightly higher earnings for the third quarter today relative to the end of last week and relative to the end of the quarter. In addition, the index is still reporting (year-over-year) earnings growth above 25% for the 3rd straight quarter.
Overall, 24% of the companies in the S&P 500 have reported actual results for Q3 2026 to date. Of these companies, 83% have reported actual EPS above estimates, which is above the 5-year average of 78% and above the 10-year average of 77%. In aggregate, companies are reporting earnings that are 2.1% above estimates, which is below the 5-year average of 7.5% and below the 10-year average of 8.0%. Historical averages reflect actual results from all 500 companies, not the actual results from the percentage of companies that have reported through this point in time.
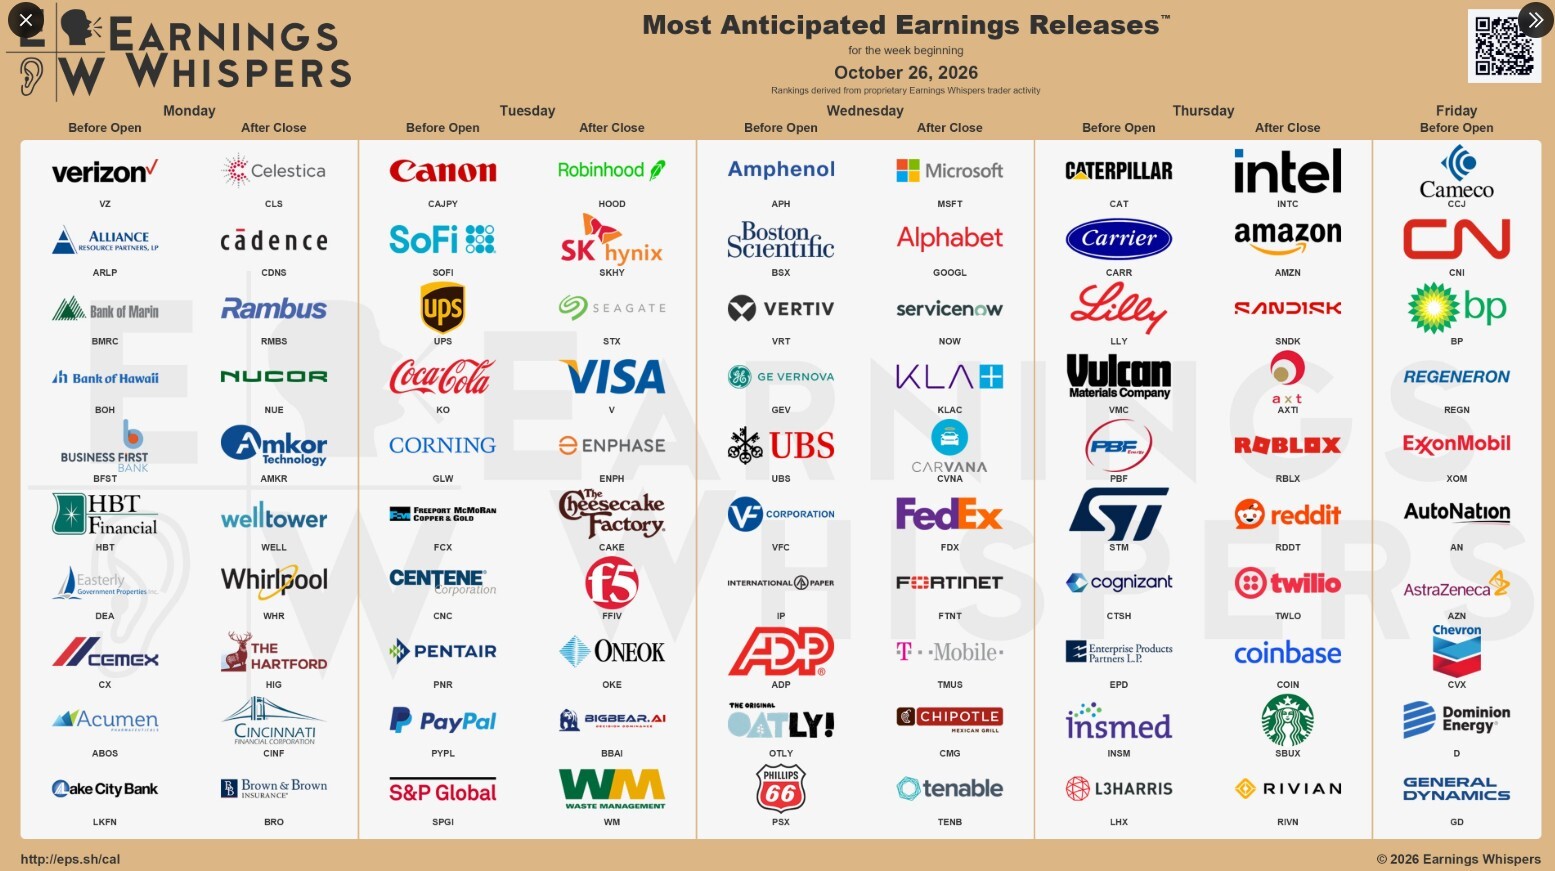
Economic Reports of Note (All Times EST):
Monday
8:30 am – US: Chicago Fed National Activity
10:30 am – US: Dallas Fed Manufacturing Business Index
11:30 am – US: 3 & 6-month Bill Auctions
1:00 pm – US: 2-year Note Auction
Tuesday
8:00 am – US: Building Permits
8:15 am – US: ADP Employment Change
8:30 am – US: Durable Goods
8:55 am – US: Redbook
9:00 am – US: House Price Index
10:00 am – US: Conference Board Consumer Confidence
10:00 am – US: New Home Sales
10:00 am – US: Richmond Manufacturing & Services Index
10:30 am – US: Dallas Fed Services Revenue
11:30 am – US: Atlanta Fed GDPNow
1:00 pm – US: 5-year Note Auction
9:00 pm – NZ: Royal Bank of New Zealand Interest Rate Decision
Wednesday
7:00 am – US: Mortgage Data
8:30 am – US: Retial & Wholesale Inventories
9:45 am – CAN: Bank of Canada Interest Rate Decision
10:00 am – US: Atlanta Fed GDPNow
10:30 am – US; Crude Oil Inventories
1:00 pm – US: Fed Interest Rate Decision
1:30 pm – US: FOMC Press Conference
Thursday
8:30 am – US: PCE
8:30 am – US: GDP
8:30 am – US: Personal Income & Spending
8:30 am – US: Weekly Jobless Claims
9:15 am – EU: ECB Interest Rate Decision
10:00 am – US: Atlanta Fed GDPNow
10:00 am – US: Dallas Fed PCE
11:30 am – US: 4 & 8-week Bill Auctions
1:00 pm – US: 7-year Note Auction
4:30 pm – US: Fed’s Balance Sheet
11:00 pm – JAP: Bank of Japan Interest Rate Decision
Friday
8:30 am – US: Employment Cost Index
9:45 am – US: Chicago PMI