
This is the one week the entire Prosper roster is in the same room. Three days at The Wynn Las Vegas Resort – nine coaches, headline guests, live trading, and a floor full of traders leveling up together.

WHAT IS “MOVING?”
Wall Street ended higher on Friday as investors shifted their focus to this coming week, with third-quarter earnings season set to start and inflation data expected, which could shed light on the Federal Reserve’s next policy decision. The The S&P 500 reached an all-time intraday high of 7,820.57 on Friday and an all-time record close of 7,818.93 on Tuesday.
The mood of American consumers, who shoulder about 70% of the US economy, has soured this month, according to the University of Michigan, with near-term expectations deteriorating to an all-time low (more on that below).
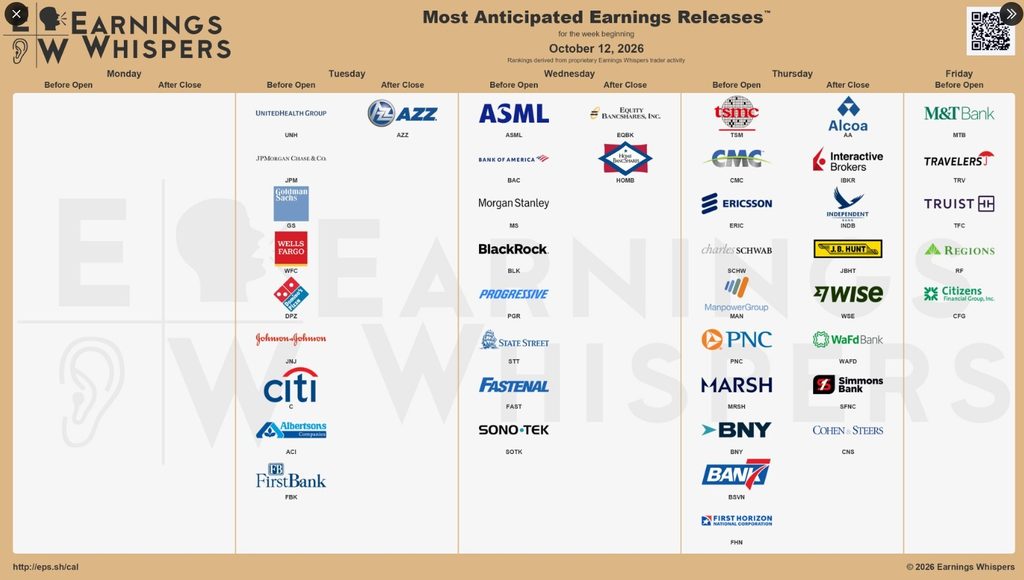
Third-quarter reporting season begins in earnest next week, with big US banks Wells Fargo, Goldman Sachs, Citigroup, JPMorgan Chase, Bank of America and Morgan Stanley scheduled to release results.
Analysts estimate S&P 500 annual earnings growth of 30.6%, on aggregate, for the July-September period, with energy and technology posting the largest year-on-year earnings growth of 123% and 66.5%, respectively, according to LSEG data.
Wednesday’s Consumer Price Index report, perhaps the most closely watched inflation gauge, is among the last key data releases before the Federal Reserve meets at the end of October to decide whether to raise interest rates. The Fed hiked rates last month for the first time since 2023 to try to contain inflation.
Wednesday’s September CPI report is expected to show a 3.7% rise on an annual basis, according to a Reuters poll. The core measure, excluding volatile energy and food components, is estimated to increase by a more modest 2.5%. The Fed targets a 2% annual inflation rate.
In addition, we will get reports on producer prices (PPI) and retail sales. These should give a fuller picture of the economy as the markets have reduced expectations the Fed will increase rates again later this month.
For the week, the DOW gained +0.9% to 51,655, the S&P 500 rose -1.2% to 7,812, the Nasdaq added +0.6% to 27,366 and the Russell 2000 continued to lag, losing -0.9% to 2,807. The CBOE VIX declined -3.1% to 14.84.

We Know About the VIX But What About MOVE?
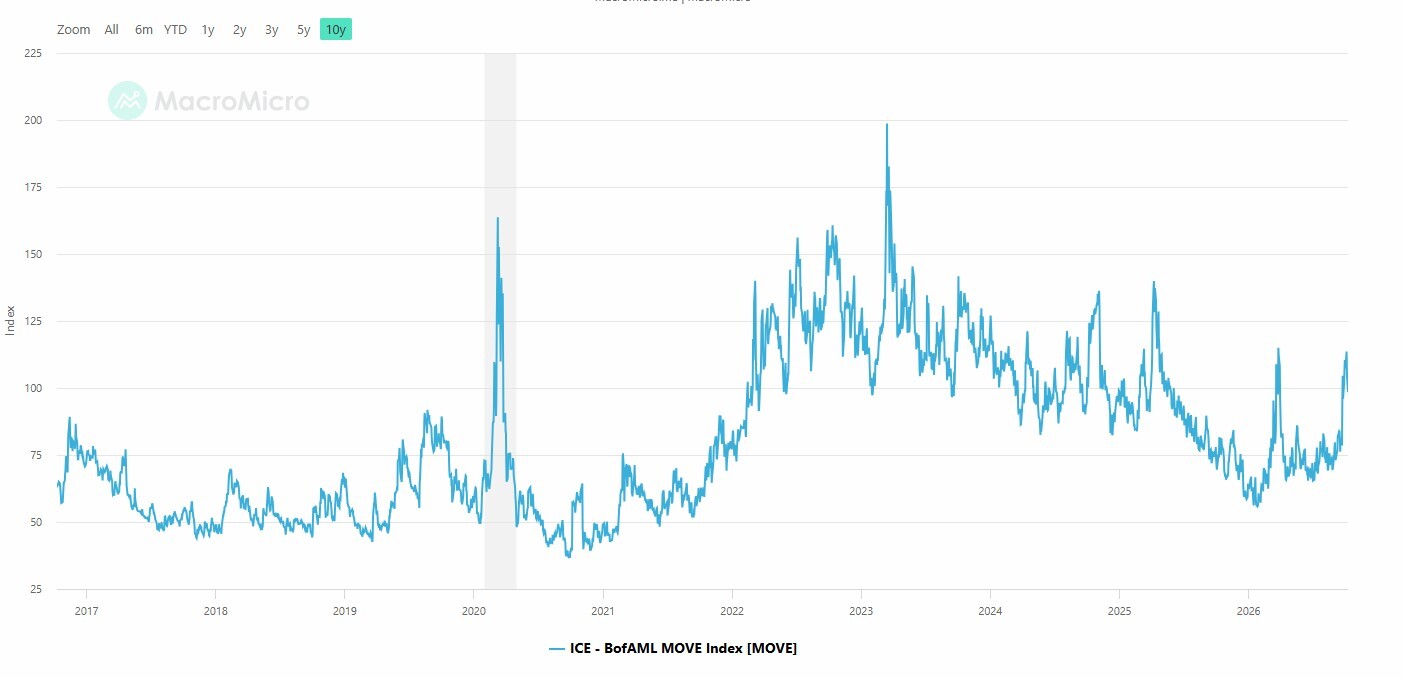
The Merrill Lynch Option Volatility Estimate (MOVE) Index reflects the level of volatility in U.S. Treasury futures. The index is considered a proxy for term premiums of U.S. Treasury bonds (i.e., the yield spread between long-term and short-term bonds).
Often called the “VIX for bonds,” it measures volatility in the fixed-income market the same way the CBOE Volatility Index (VIX) measures volatility in the stock market A key point is that the MOVE index measures the potential size of yield moves, not the direction. The MOVE index frequently signals macroeconomic stress, inflation fears, or shifts in central bank policy well before turbulence shows up in the stock market via the VIX.
By late summer 2026, the MOVE was rising steadily while the VIX was falling, indicating bonds might be pricing in more volatility soon even as the equity market priced in comparatively little. This could reflect inflation fears and concerns that Japan (the largest foreign holder of U.S. debt) might begin selling Treasuries to help buy back yen and stabilize its own currency. That would push up yields as a supply glut of Treasuries hits the market.
MOVE Index Levels And What They Signal
The MOVE index does not have a universal “normal” level because volatility changes across market regimes. In general:
A higher MOVE index suggests the market expects larger yield swings, often when policy, inflation, or liquidity uncertainty rises.
A lower MOVE index suggests the market expects smaller yield swings and has more confidence in the near-term rate path.
How the MOVE Index is Calculated
The MOVE index is derived from implied volatility in one-month at-the-money options linked to the current 2Y, 5Y, 10Y, and 30Y Treasuries.
1) It uses one-month, at-the-money Treasury options
The ICE BofA US Bond Market Option Volatility Estimate Index (MOVE) is built from at‑the‑money one‑month options on the current 2Y, 5Y, 10Y, and 30Y Treasuries.
2) It weights the yield curve
The common weighting approach is:
- 20%: 2‑year
- 20%: 5‑year
- 40%: 10‑year
- 20%: 30‑year
That heavier 10‑year weight matters because the 10‑year is a key benchmark rate that anchors many macro narratives and cross-asset valuations.
The Divide By 16 Rule Of Thumb
If the MOVE index is at 100, dividing by 16 gives roughly 6, which corresponds to about 6 basis points per day of market‑implied movement (close-to-close) over roughly the next month of trading days.
That means you can do quick mental math:
- MOVE index 50 suggests about 3.1 bps/day
- MOVE index 75 suggests about 4.7 bps/day
- MOVE index 100 suggests about 6.3 bps/day
- MOVE index 150 suggests about 9.4 bps/day
- MOVE index 200 suggests about 12.5 bps/day
This does not forecast tomorrow’s move. It reflects the scale of movement implied by options pricing.
Central bank messaging and meeting risk
Because MOVE is based on one‑month options, it’s sensitive to the “next major thing,” like a central bank meeting or a high-impact data release. Bassman specifically notes MOVE is a one‑month window. It is useful, but inherently near term.

How Ya Feelin’?
US consumer sentiment slumped further in early October as the rising cost of living because of the Middle East conflict soured households’ views of the economy, more bad news for President Donald Trump ahead of the November 3 midterm elections.
The University of Michigan’s Surveys of Consumers was the latest in a series of recent polls to capture the darkening mood among Americans, who are being squeezed by high inflation and borrowing costs. The University of Michigan’s Consumer Sentiment Index dropped to 46.3 this month from 48.1 in September. The third straight monthly decline pushed sentiment close to a record low plumbed in May. Economists polled by Reuters had forecast the index at 47.8.
The US-Iran war has raised energy prices, fanning inflation and prompting the Federal Reserve to raise interest rates in September for the first time in three years.
Sentiment deteriorated sharply this month among lower-income consumers and those with smaller stock portfolios, the University of Michigan said on Friday. There was also a decline in morale among respondents identifying as Independents. Though there was an uptick among Democrats and Republicans, sentiment remained considerably lower than it was in January this year.
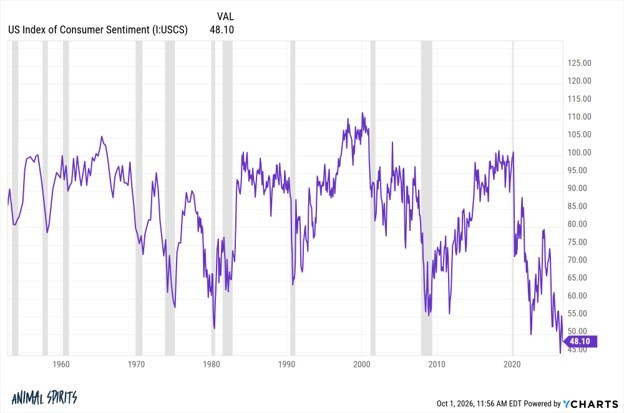
Weak sentiment likely does not mean a significant slowdown in consumer spending as the relationship between the two has weakened over the years. The economy also resembles what economists describe as a K-shape, where the higher-income households are doing well, partly thanks to a strong stock market performance, compared to their middle- and lower-income counterparts, whose budgets are under strain.
Consumer spending is mostly being driven by higher-income households. That was reinforced by a separate report from the University of Michigan showing just under a third of consumers expected to spend as usual in the coming year on items that have experienced large price increases, while 54% said they would cut back. About 16% of consumers said they would stop buying. The report also noted that higher income consumers were more likely to maintain spending than their lower-income counterparts.

Happy Birthday to You, Happy Birthday to You…
The current equity bull market will pass its four-year mark early next week. Since bottoming on Oct. 22 in 2022 at 3,577, the S&P 500 is up 117%.
Inevitably, such an anniversary will have some worrying that the bull is showing signs of age, with chances of its demise increasing as it trundles on. But history shows bull markets that get past their fourth year rarely throw in the towel. Of the six prior bull markets that extended beyond their fourth year, all but one saw further gains in the fifth year.
The average gain for bull markets since the 1950s is 184%, and it’s important to note that they tend to see their strongest performances near the beginnings and ends of the cycles. Investors should also remember that pullbacks are typical, with the average maximum drawdown during Year 5 of 14%.
Valuations are supportive of an extended bull run, too. During the fourth year of the rally it’s been rising earnings rather than expanding valuations that have powered the S&P 500’s advance, with the benchmark’s forward price-to-earnings multiple falling from 23 a year ago to the current roughly 19. The technology sector’s P/E multiple has over the same period dropped from 32 to 22, a completely different trajectory from that seen during the dot-com bubble.
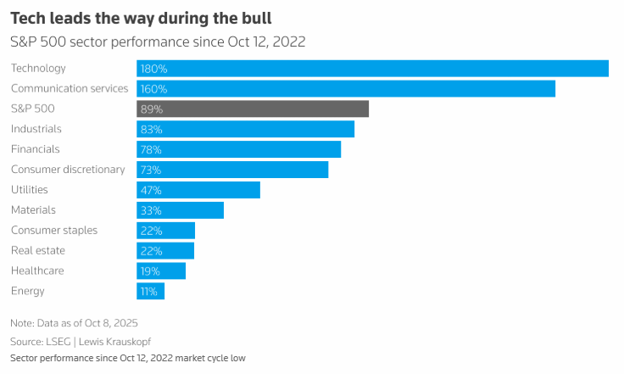
Technical and seasonal tailwinds also continue to support the bull market strength. The S&P 500’s primary trend remains positive, led by the tech sector and AI-related megacaps and while healthy bull markets often reset through rotation rather than broad liquidation, as we’ve seen on several occasions in recent years, tech leadership is likely to continue.
That said, broader participation in the rally would strengthen the bull market further as equity markets are generally healthier when a wider group of stocks is advancing.
I would be remiss if I also didn’t identify some of the risks that may cause the bull to expire before its fifth birthday: further tightening in financial conditions caused by Federal Reserve interest-rate hikes and higher bond yields; geopolitical tensions and energy prices staying higher for longer; the currently high bar for earnings surprises that may lead to disappointment; the market’s overdependence on tech, particularly the artificial-intelligence trade; and a widening of credit spreads as investors fret about soaring AI capital expenditure.
But continued economic growth, resilient earnings, more reasonable valuations, and generally favorable seasonal trends and historical precedent suggest the cycle still has further room to run.
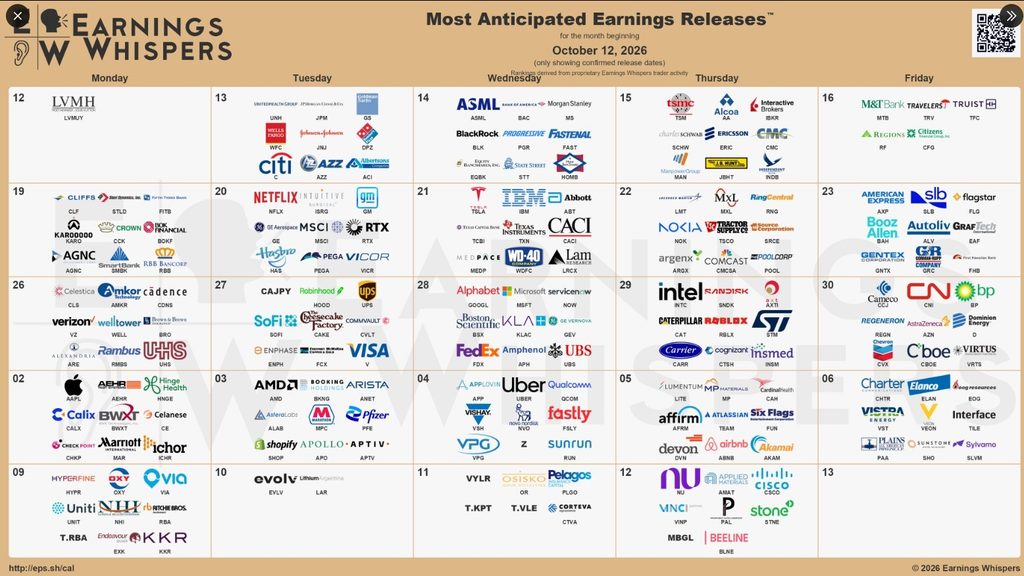
Economic Reports of Note (All Times EST):
Monday
Tuesday
6:00 am – US: OPEC Monthly Report
6:00 am – US: NFIB Small Business Optimism
8:15 am – US: ADP Employment Change
8:55 am – US: Redbook
10:00 am – US: Existing Home Sales11:30 am – US: 3 & 6-month Bill Auctions
1:00 pm – US: FOMC Member Barking Speaks
2:00 pm – US: Federal Budget Balance
4:00 pm – US: Fed Member Collins Speaks
Wednesday
7:00 am – US: Mortgage Data
8:30 am – US: CPI
8:30 am – US: Real Earnings
11:00 am – US: Cleveland CPI
1:30 pm – US: FOMC Member Barkin Speaks
2:00 pm – US: Beige Book
Thursday
2:00 am – UK: GDP
8:30 am – US: Retail Sales
8:30 am – US: PPI
8:30 am – US: Weekly Jobless Claims
8:30 am – US: NY Empire State Manufacturing Index
8:30 am – US: Philly Fed Business Conditions
10:00 am – US: Business & Retail Inventories
11:30 am – US: Atlanta Fed GDPNow
11:30 am – US: 4 & 8-week Bill Auctions
12:00 pm – US; Crude Oil Imports
Friday
5:00 am – EU: CPI
8:30 am – US: Import/Export Price Index
9:15 am – US: Industrial & Manufacturing Production
9:15 am – US: Capacity Utilization Rate