

DOES IT NEED TO BE SPOOKY?
Markets can be volatile, and no month illustrates that more clearly than October. From the banking panic of 1907 to Black Monday in 1987 to the depths of the 2008 financial crisis, some of the most dramatic single-day collapses in U.S. stock market history have one thing in common: They happened in October. (More on that below).
This week, financial markets were defined less by equity volatility and more by growing stress beneath the surface of the bond market. Oil prices and technology stocks remain key drivers of overall market sentiment, with energy continuing to contribute to inflation and interest rate concerns.
September proved a volatile month for yield traders and bond investors with the Federal Open Market Committee (FOMC) raising its target rate range by 25 basis points. The underlying trend continues: stubborn inflation, with the U.S. benchmark price for crude oil (/CL) up nearly 5% during September and still elevated, up about 1% to near $91 per barrel last week, without an agreement between the U.S. and Iran.
Second-quarter GDP was revised sharply higher to a 2.2% annualized rate from the previous 1.5% estimate, which economists had expected to remain unchanged. August headline PCE rose 0.3% month over month, below the 0.4% estimate, while core PCE increased 0.2% and was 3.0% year over year, below the estimate of 3.3%. That said, Friday’s softer jobs report could deter the FOMC from an October interest rate hike. According to the CME FedWatch tool, the probability of an October rate hike fell below 25% Friday after hitting 70% Monday. (Recall how I have been suggesting a huge downward revision from the “blowout” August jobs report. Not only was it August but July was revised lower as well.)
Investors head into a part of the calendar that tends to be upbeat for US stocks, but that seasonal strength is under threat from a number of challenges, including a surge in bond yields and the market’s apparent dependence on massive AI spending.
As the fourth quarter kicks off, the stock market is already on pace for a solid year. The benchmark S&P 500 as of Friday has gained nearly 13% year to date, and sat about 1% below its mid-August record high.
For the month of September, equity returns were mixed: the S&P 500 (SPX) was down fractionally, the Dow Jones Industrial Average ($DJI) slipped more than 4%, and the Russell 2000 (RUT) fell more than 5%. The tech-heavy Nasdaq-100 (NDX), however, rose more than 3% in September.
For the week, the DOW lost -1.3% to 51,117, the S&P 500 slid by -0.3% to 7,723, the Nasdaq rose by 0.5% to 27,191 and the Russell 2000 edged lower by -0.2% to 2,833. The CBOE VIX closed higher by +3% to 15.31.

Are Rates There?
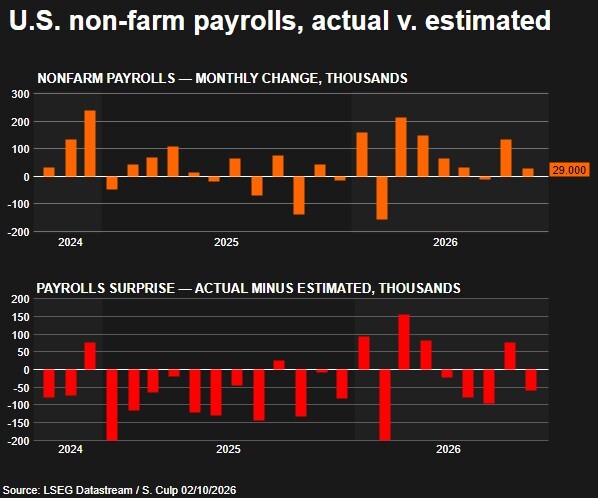
The September nonfarm payrolls data came in lighter than expected. Payrolls increased by 29,000 versus expectations of 89,000 and the unemployment rate increased to 4.2% from the previous 4.1%. Average hourly earnings was light at up 0.1% on a month over month basis and up 3% year over year, both of which missed expectations of 0.3% and 3.1% As mentioned above, job growth for August was revised down by 29,000 and July was revised lower by 31,000.
Stocks moved higher on the news and yields fell – initially. Yields, however, rose again, as the bond market resumed an ongoing selloff that has seen global yields rise to levels not seen in two decades.
But treasuries remain front and center. On Thursday, the 10-year yield briefly reached 5.34%, its highest level since 2002, before finally retreating. That decline broke a streak of seven consecutive trading days of rising yields, which had become one of the clearest signs of tightening financial conditions. The 30-year yield also reached multi-decade highs as investors demand greater compensation for inflation when purchasing government debt, in combination with stronger-than-expected economic growth.

Who remembers Jim Nabors role as Gomer Pyle? The following information may come as a surprise!
What history suggests after sharp increases in yields
Rising interest rates have been front and center for investors over the past month, and for good reason. Since 1990, there have been just six months, including this September, in which both the 2-year and 10-year Treasury yields rose by at least 50 basis points (0.5%).
Following the five previous episodes, the S&P 500 generated a positive return four times over the subsequent six months and three times over the subsequent three months. While not shown in the table, 12-month forward returns followed a similar pattern, with positive returns in all instances except 2002.
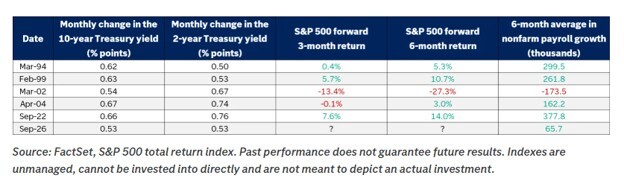
The table shows that in the five months outside of September 2026 where both the 2-year and 10-year Treasury yields rose by 0.5% or more in a given month, average six month forward returns were positive in four of five instances and positive in three of five instances over the subsequent three months. When accounting for the times when trailing six-month payroll growth was positive, returns were positive in each of the four instances over the subsequent six months and in three of four instances over the subsequent three months.
Quarter 4 and The October Effect
Markets face a busy end of 2026, with the start of corporate earnings season and a pivotal Federal Reserve meeting in coming weeks, along with the looming November 3 midterm elections that will decide control of the US Congress.
Since 1945, the S&P 500 averaged an increase of 4.2% in the fourth quarter, with the index posting gains 85% of the time, according to research firm CFRA. That average percentage rise is more than twice that of the other three quarters.
Fourth quarters of midterm years have generally been even stronger, with an average gain of 6.4%, as stocks “benefit from the lifting of election uncertainty,” Sam Stovall, chief investment strategist at CFRA, said in a note. But let’s focus on the spooky month of October.
As we know, markets can be volatile, and no month illustrates that more clearly than October. From the banking panic of 1907 to Black Monday in 1987 to the depths of the 2008 financial crisis, some of the most dramatic single-day collapses in U.S. stock market history have one thing in common: They happened in October.
Yet the data tells a more complicated story. Over 95 years of S&P 500 returns, October averages a slightly positive return and finishes higher roughly 59% of the time. The real story is not that October is the worst month; it is that October is the most volatile. For traders and investors, that volatility creates both risk and opportunity, and understanding the historical pattern is the first step to navigating it.

The October Effect, also called the Mark Twain Effect, is the widely held belief that stock markets tend to decline in October. Despite the concept’s staying power, long-term market data does not show October as the weakest month for U.S. stocks.
Here I present some data behind October’s reputation and delve into what the numbers actually show.
- Since 1928, the S&P 500 has averaged an October return of approximately +0.54%, despite the month’s reputation for market crashes.
- October has historically recorded the highest monthly return volatility, with a standard deviation of approximately 5.6% in the dataset analyzed.
- The VIX reached an intraday high of 89.53 on October 24, 2008, during the global financial crisis.
- October has accounted for eight of the 20 largest single-day percentage declines in the historical S&P 500 series used in this analysis.
- September, not October, has historically been the weakest month, averaging approximately -1.17% since 1928.
- October has also frequently coincided with major market reversals, contributing to its reputation as a “bear killer.”
- Key stats: October has averaged approximately +0.54%, finished positive about 59% of the time, and recorded monthly return standard deviation of approximately 5.6%.
It is important to distinguish between intraday and closing VIX records. The VIX reached its historic intraday peak of 89.53 on October 24, 2008. It later closed at 80.86 on November 20, 2008, which was the highest closing level during the financial crisis. The October intraday figure is therefore the more relevant statistic for this analysis.
And daily market moves? October has featured disproportionately in some of the S&P 500’s largest daily market moves. In fact, eight of the 20 largest single-day percentage declines occurred in October:
- October 19, 1987: -20.47%
- October 28, 1929: -12.34%
- October 29, 1929: -10.16%
- October 18, 1937: -9.27%
- October 15, 2008: -9.04%
- October 26, 1987: -8.28%
- October 5, 1932: -8.20%
- October 9, 2008: -7.62%
October has also produced several exceptionally large rebounds. Notable examples include October 13, 2008 (+11.58%), October 28, 2008 (+10.79%) and October 21, 1987 (+9.10%).
This history illustrates an important feature of October volatility: Extreme moves have occurred in both directions, with sharp declines sometimes followed by equally significant rebounds.
Economic Reports of Note (All Times EST):
Monday
5:00 am – EU: PPI
9:45 am – US: S&P Global Composite & Services PMI
10:00 am – US: ISM Non-Manufacturing PMI
11:30 am – US: 3 & 6-month Bill Auctions
11:35 pm – JAP: 10-year JGB Auction
Tuesday
7:15 am – US: ADP Employment Change
8:30 am – US: Trade Balance
8:55 am – US: Redbook
10:45 am – US: FOMC Member Bowman Speaks
11:30 am – US: Atlanta Fed GDPNow
1:00 pm – US: 3-year Note Auction
Wednesday
7:00 am – US: Mortgage Data
10:30 am – US: Crude Oil Inventories
11:00 am – US: NY Fed 1-Year Consumer Inflation Expectations
1:00 pm – US: 10-year Note Auction
2:00 pm – US: FOMC Meeting Minutes
3:00 pm – US: Consumer Credit
11:30 pm – JAP: 30-year JGB Auction
Thursday
4:30 am – US: Fed Member Waller Speaks
8:30 am – US: Weekly Jobless Claims
10:00 am – US: Wholesale Inventories & Trade Sales
10:00 am – US: Construction Spending
11:30 am – US: Atlanta Fed GDPNow
11:30 am – US: 4 & 8-week Bill Auctions
1:00 pm – US: 30-year Bond Auction
Friday
10:00 am – US: Michigan Consumer Sentiment
10:00 am – US: Michigan 1 & 5-year Inflation Expectations