

THE JEFFERSONS
Why am I featuring George & Louise this week? Well, just like them, rates are MOVIN’ ON UP! We will get into more detail below.
Despite all that volatility over the past few days, the stock market put together a pretty decent week. It certainly was a rollercoaster of a week on Wall Street, but stocks closed Friday’s session higher and managed to climb for the week despite bond yields rising to multi-year highs.
Equity indexes showed resilience despite threats, mainly the continued march higher in Treasury yields, as a selloff extended with investors demanding greater compensation to hold government bonds. The 30-year Treasury yield this week reached its highest level in over 20 years and the benchmark 10-year yield rose well above the closely watched 5% threshold.
The yield on the 10-year Treasury note rose to levels not seen in years. But it’s not necessarily the outright level that’s most concerning for those on Wall Street, it’s the speed of the move. When rates climb at such a rapid pace, history tells them something bad tends to happen. The 10-year yield saw its most rapid one-day increase since April 7, 2025, on Wednesday, rising further on Thursday to top 5.17%, quite a move considering two weeks ago it was below 4.8% and at one point in August, it was below 4.6%. (More below).
Coming up this week is not only important inflation data but also the September nonfarm payroll report. It is expected to show growth of 100,000 jobs and an unemployment rate of 4.2%, according to a Reuters poll of economists. A blowout jobs report last month solidified expectations the Fed would raise rates. The central bank hiked rates by a quarter percentage point on September 16, and signaled it would raise again before the year is out. Fed Funds futures on Thursday suggested a greater than 65% chance the central bank hikes at its next meeting in October, according to the CME FedWatch Tool.
For the week, the DOW gained +0.3% to 51,829, the S&P 500 added +1.2% to 7,743, the Nasdaq Rallied +2.1% to 27,069 and the Russell 2000 lost -0.8% to 2,838. The CBOE VIX closed higher by +0.4% to 14.87.
Are Rates There?
A chart of the 10-year Treasury yield going back the last five decades shows that there have been 16 instances where it experienced a rapid advance like it is now. During each and every move, some sort of financial calamity resulted. While the scale of the crises varied in their market impact (from the jarring-but-short-lived Silicon Valley Bank failure of 2023 to the 1987 stock market crash), the jump in yields almost always led to some sort of disruption to financial markets that weighed on risk assets.
The 10-year Treasury yield is a benchmark for borrowing costs across the economy. Everything from mortgage rates to sophisticated hedge fund trades can become contingent on a stable 10-year yield. When it soars quickly, it can unravel risky plans by companies or investors that were counting on a stable borrowing rate.
What will crack this time around? It’s usually not evident until it is too late and it is not always directly related to borrowing costs on the surface. The Dotcom Bubble burst was because of a multitude of reasons, mostly unrealistic valuations for many tech businesses earning zero profits. But higher rates played their part. During the housing crisis, rising rates directly exposed the lax lending standards by banks as borrowers using floating-rate debt increasingly couldn’t pay.

Watch the regional banks
Regional banks will be particularly important to pay attention to this time around, The State Street SPDR S&P Regional Banking ETF (KRE) has already fallen nearly 10% below its recent high, just a hair away from correction territory. Looking at the past mishaps sparked by high rates, the banking sector is typically punished the hardest.
It would seem extremely important that the regional banks especially remain firm or have a minimal or not problematic decline. If regional banks continue to go down, and then of course banks in general, a strong market is probably not in the cards.
Cracks are also starting to show in utilities and homebuilders. In the past week alone, the S&P 500 utilities sector has fallen more than 4%, becoming far and away the biggest laggard out of the index’s 11 groups.
JPMorgan’s trading desk in a Thursday note that investors should “keep an eye on bond [volatility],” because that is usually a “bigger” headwind to stocks than their absolute levels.

Yields on the US’s longest-dated bonds climbed to the highest level in more than two decades, the latest milestone in a global selloff driven by inflation fears and concern about government debt burdens.
A fresh jump in oil prices on Thursday lifted five- to 30-year Treasury yields to new multiyear highs, with the 30-year rising to levels just shy of 5.5%, the highest since 2004. Ten-year yields rose 10 basis points to 5.21%, the highest since 2007.
The selloff extended to other major global bond markets, with European yields also mostly on the rise, and those on Japan’s government debt hitting levels last seen in 1996 as the market reopened after a three-day break.
The average yield on government debt worldwide now stands within a whisker of 4%, the highest since 2007, Bloomberg’s Global Aggregate Treasuries index shows. It’s another reminder of the end of the low-yield era as markets contend with the inflationary impact of the war in Iran, a robust US economy and a torrent of bond sales from governments and tech companies.
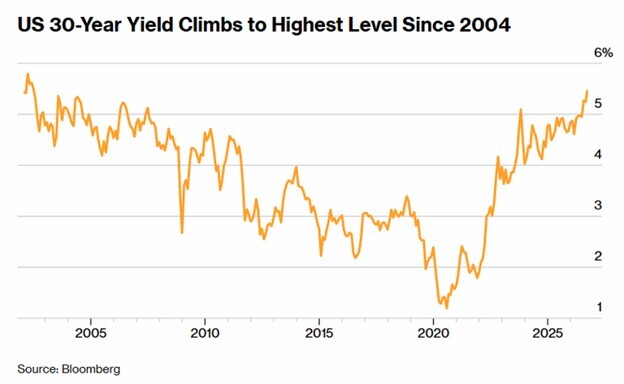
In the Treasury market, two-year yields have climbed over 150 basis points since the start of the US-Iran war, while those on the 30-year are up over 80 basis points.
The continued yield rise undercuts the Treasury’s efforts to bring down long-term borrowing costs: Treasury Secretary Scott Bessent expanded the government’s bond buyback program in mid-August in an effort to ease pressure.
On Thursday, the department accepted $4.08 billion of the $6 billion maximum it targeted in an operation for 20- to 30-year securities. Yields rose, signaling disappointment with the outcome. The Treasury also bought back less than it sought at its in first expanded buyback on Sept. 10.

Economic Reports of Note (All Times EST):
Monday
10:30 am – US: Dallas Fed Manufacturing Business Activity
11:30 am – US: 3 & 6-month Bill Auctions
1:30 pm – US: FOMC Member Barkin Speaks
9:30 pm – AUS: Royal Bank of Australia Interest Rate Decision
Tuesday
8:30 am – CAN: GDP
8:55 am – US: Redbook
9:00 am – US: House Price Index
10:00 am – US: Conference Board Consumer Confidence
10:00 am – US: JOLTS
10:30 am – US: Dallas Fed Services Revenues
1:00 pm – US: Fed Member Goolsbee Speaks
2:00 pm – US: FOMC Member Williams Speaks
Wednesday
2:00 am – UK: GDP
7:00 am – US: Mortgage Data
8:15 am – US: ADP Nonfarm Employment Change
8:30 am – US: PCE
8:30 am – US: GDP
8:30 am – US: Personal Income & Spending
8:30 am – US: Wholesale Inventories
9:45 am – US: Chicago PMI
10:00 am – US: Atlanta Fed GDPNow
10:00 am – US: Dallas Fed PCE
1:30 pm – US: FOMC Member Barkin Speaks
3:25 pm – US: Fed Governor Cook Speaks
Thursday
5:30 am – US: Challenger Job Cuts
8:30 am – US: Weekly Jobless Claims
9:05 am – US: FOMC Member Barkin Speaks
9:05 am – US: Fed Members Collins & Schmid Speak
9:30 am – EU: ECB President Lagarde Speaks
9:45 am – US: S&P Global Manufacturing PMI
10:00 am – US: ISM Manufacturing PMI
10:00 am – US: Construction Spending
11:30 am – US: Atlanta Fed GDPNow
11:30 am – US: 4 & 8-week Bill Auctions
3;30 pm – US: FOMC Member Williams Speaks
Friday
5:00 am – EU: CPI
8:30 am – US: September Nonfarm Payrolls
9:00 am – US: S&P Global Manufacturing PMI
10:00 am – US: Factory Orders
10:00 am – US: Durables